
Traditional Machine Vision Can Be Adapted to Achieve Hyperspectral Results
Even with its narrower data set, multispectral imaging can deliver much richer image data and enhanced contrast, similar to that seen in hyperspectral imaging.
By Steve Kinney
Imaging beyond the visible wavelength, such as capturing data across the hyperspectral range, has become an increasingly popular tool in industries such as agriculture, food and beverage processing (opening image), and electronics and semiconductor manufacturing.
Hyperspectral imaging, an advanced 3D technique that uses hundreds of spectral bands across the ultraviolet, visible, near-infrared, and shortwave-infrared regions of the electromagnetic spectrum, provides an incredible amount of spatial and spectral information. This capability enables a machine vision system — composed of specially configured filters, lighting, and cameras — to identify and differentiate virtually any material. In poultry processing, for example, the detailed spectral information provided by hyperspectral imaging enables the detection of defects, bruises, blood spots, and foreign materials. Likewise, in semiconductor manufacturing, hyperspectral imaging can identify microscopic defects, contamination, and layer inconsistencies in microchips.
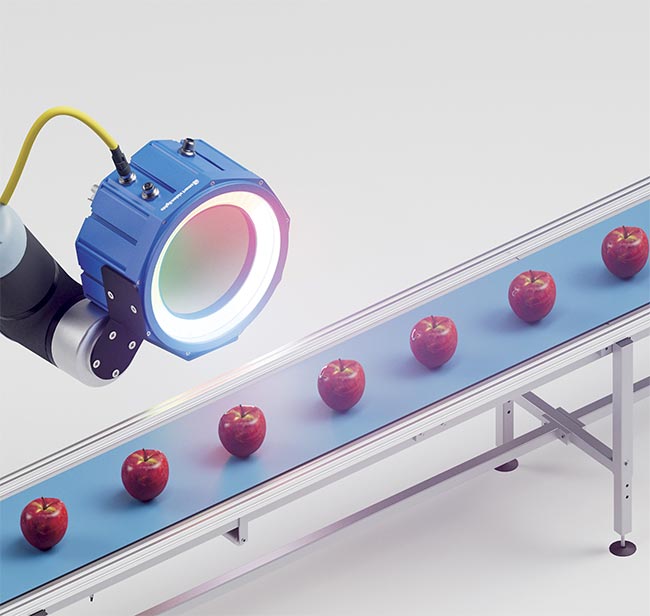
Machine vision system users can choose which spectral bands to explore — in this case, to monitor the quality of apples. Courtesy of Smart Vision Lights.
While it offers exceptional precision in materials analysis and quality control, the cost, speed, and integration complexity of hyperspectral imaging can make it less than practical in most production environments.
Hyperspectral imaging generates huge amounts of data, demanding higher bandwidth and computing power. Specialized software and
artificial intelligence models that are used to analyze this data increase the setup time and complexity of a system. Performance depends on stable lighting and minimal environmental interference, so any dirty, dusty, or highly reflective production environments will require additional filtering and calibration. In environments such as wood or food processing, for example, airborne dust can change constantly, introducing random noise into the hyperspectral data. Component costs are often prohibitively high when compared with traditional machine vision systems.
In many ways, using multispectral imaging makes much more sense
in a production environment than
integrating complex hyperspectral hardware and software. A derivative
of hyperspectral imaging, multispectral imaging is a 2D imaging technique that functions similarly to traditional machine vision — with accessible, familiar
machine vision tools such as multispectral lighting, narrowband filters, and conventional cameras. Standard machine vision systems, including multispectral systems, are easier than hyperspectral systems to integrate with existing robotics and automation that are already employed in many production environments.
The promise of multispectral imaging
What if one could have the performance advantages of hyperspectral imaging with the feasibility of more traditional machine vision? This article will cover how to use multispectral imaging systems to enable hyperspectral benefits for practical use cases in a range of production applications, such as agriculture or plastics. With minimal tweaking, multispectral imaging can make use of a narrower, more applicable data set for conventional image analysis, yet deliver much richer image data and enhanced contrast.
Multispectral imaging systems significantly reduce the complexity — and required data — of hyperspectral imaging by limiting the number of spectral bands with the aid of filter technology and focusing only on the most relevant wavelengths for a given application. Limiting the spectral bands to just a few — compared with the hundreds of bands captured in a hyperspectral system — significantly reduces the data cube storage, processing time, and computational power. This information provides a guidepost for the ultimate construction of a practical system in a production setting.
Figure 1 shows how capturing
image data narrowly filtered in two wavelengths and comparing them
ratiometrically can provide useful
data for practical machine vision
applications — in this case, analyzing coffee beans.

Figure 1. Imaging coffee beans (visible spectrum on the left) anywhere in the SWIR spectrum will find the rock. But capturing within the narrow bands ~1207 nm (center) or 1422 nm (right) can also determine the ripeness and water content of the beans. Courtesy of Smart Vision Lights.
But these capabilities can be integrated further into a production process, using a simplified, conventional image analysis to deliver significantly richer image data and enhanced contrast. Therefore, hyperspectral imaging’s rich 3D spectral and spatial data can be converted into something that conventional machine vision can analyze.
The three key steps to this translation are as follows:
1) Capture hyperspectral data of the sample and the background.
2) Identify relevant peaks and valleys within a spectral plot.
3) Build a multispectral imaging system using a conventional camera, light source, and limited bandpass filter.
Converting a complex hyperspectral plot of reflectance and absorption data into a narrower, more applicable data set for conventional image analysis empowers a significantly more robust and powerful vision system that delivers much richer image data and enhanced contrast.
Plotting hyperspectral data
The first step is intended to identify the spectral bands where samples share contrasting signals. This would typically be a 2D spectral plot of a sample — whether it is a leaf from a crop or a plastic material. Relevant background data can also be included.
Compare each sample’s relative intensity, considering peaks in common axes over normalized ranges. Then, overlay the data to identify peaks of contrast and unique areas.
Identifying spectral peaks
To be clear, if an application requires pixel-by-pixel spectral data on a sample, then a hyperspectral camera that can capture all spatial and spectral data in a 3D cube would be more suitable. But that would also be more complicated than using the 2D spectral plot described here.
Likewise, if an application requires the comparison of too many peaks, such as in food processing or environmental monitoring, a hyperspectral camera might be preferable. But if you can narrow a hyperspectral plot to one, two, or three peaks of interest, multi-
spectral imaging using narrowband lighting and filtering offers compelling possibilities for practical analysis.
If a user is lucky, an application can be narrowed down to just one peak of interest. This will be the case if an application has just a single variable characterized by two values — whether an apple is bruised, for example — and if an area can be found where both variables do not occupy the same band. This would allow a user to apply a narrowband light source with a notch filter at that peak to identify otherwise undetectable bruises in fruit or foreign matter among coffee beans.
Figure 2 shows how the 1050-nm spectral band is better equipped to show bruising on an apple.

Figure 2. Imaging in the 1050-nm spectral band (right) better captures the higher moisture content of bruises because of a known water
absorption band. Using a bandpass filter can increase this image contrast. Courtesy of Smart Vision Lights.
But sometimes one peak is not enough. Many vision applications will need to compare spectral peaks for two or more samples — such as distinguishing ripe and nonripe coffee beans from each other, as well as twigs and stones that may be mixed in a sample.
To illustrate this, consider an application that compares the health of grass in a field while distinguishing other samples, such as fir and walnut trees. In all, the analysis must distinguish four samples for the extraction of relevant information: healthy grass, dry grass, and two types of trees.
As shown in the graph in Figure 3, there is not a single wavelength at which all four samples could be uniquely identified. So, finding a solution that effectively differentiates between the samples requires looking at more than one peak.

Figure 3. By examining spectral information around both the 850- and 1200-nm wavelengths, the samples that are present in each pixel of the frame can be determined. Courtesy of Smart Vision Lights.
The first step in differentiation is to overlap spectral data for all four samples, which can be accomplished graphically via software, taking care to align their peaks in a common axis over a normalized range. Looking for maximum differences in spectral peaks will reveal unique areas of contrast and help to identify appropriate wavelengths to consider.
One area of unique contrast in
the example of the grassy field is
at 850 nm, where healthy grass is clearly discernible from yellow grass. The analysis can also distinguish the trees from the grass. It cannot determine whether those trees are firs or walnuts. However, it is possible to distinguish fir trees from walnut trees
by examining additional spectral information around 1150 to 1250 nm, which reveals specific characteristics of different species.
By themselves, neither the 0.8-μm peak nor the 1.2-μm peak provide enough data to clearly distinguish the four samples from one another. But by capturing image data through narrowband filters centered on each band, and applying Boolean logic (a mathematical tool that results in positive or negative values) to the presence or absence of peaks, the samples that are present in each pixel of the frame can be determined.
Overlapping spectral data isolates unique areas of contrast where the spectral signals from various samples exhibit a wide difference. It is also important that the spectral signals in these areas are characterized by flat, horizontal lines in a readout to minimize jitter.
Building the system
To put this methodology into practice on the production floor, several options can be considered for system components, including filters, lighting, and cameras. In large part, the choices made by the user will depend on the spectral bands desired for capture.
Optical filter technology can isolate areas of interest for an application from the rest of the spectrum, so the filter array must match the identified peaks. It might even be possible to get by with just one filter, since multiple bandpass wavelengths can be built into a single filter.
Because LED lighting provides specific, narrow wavelengths, it allows for precise wavelength selection, which is ideal for certain machine vision applications, such as those described above. With a broad range of available wavelengths, LEDs provide the flexibility to select the precise area of interest to isolate the bands needed to differentiate a sample with multispectral imaging.
If the LED does not zero in on the right narrow band, filtering can be applied to make the wavelength more precise for specific sample analysis.
In the example of grass and trees, achieving the desired results with just two wavelengths proved to be possible. Depending on the complexity of an application, however, five bands might be needed, prompting a more complex combination of LEDs and filters. This is where a multiband filter might prove to be a valuable component for integration.
A custom filter like this can be expensive, but could nonetheless be considerably more practical than having to rely on a full hyperspectral setup, and substantial hardware and software requirements.
LED lighting works well for structured, controlled environments that employ machine vision, such as industrial inspection or food sorting. LEDs are excellent for highlighting specific materials or surface features in pharmaceuticals, food inspection, and an increasing array of agricultural applications.
Ultimately, lighting and filter choices must also go hand-in-hand with the camera selection. But with LEDs and filters commonly already tailored to isolate spectral bands, a standard machine vision camera is often all that is needed to capture specific details.
Monochrome cameras can offer a flexible and simple solution for many vision applications that use hyperspectral data, such as quality inspection. A standard monochrome camera, however, does not cover the SWIR range, so the choice might depend on the wavelengths needed. And while an indium gallium arsenide (InGaAs) camera provides the best performance in the SWIR range, it works only in that range. So, if the application must capture wavelengths across a wider spectrum, the imaging system has historically needed to apply more than one type of camera for acquiring spectral and spatial data.
Newer camera technologies that can capture wavelengths from UV all the way to SWIR are further simplifying multispectral imaging. An innovative imaging technology from Sony significantly expands the detectable spectrum of traditional InGaAs sensors. Conventional InGaAs sensors are typically limited to the 900- to 1700-nm range. Sony’s hybrid approach integrates InGaAs photodiodes with a custom-designed CMOS readout circuit, leveraging a
hybrid pixel structure sensitive to shorter wavelengths. By combining visible and SWIR imaging capabilities, the technology reduces the need for multiple cameras in various industrial and scientific applications, such as semiconductor inspection, food quality control, material sorting, among others.
Quantum dot cameras also detect UV all the way to SWIR. Using standard CMOS sensors covered with a quantum dot layer, these cameras promise lower costs than hybrid InGaAs. They struggle to some degree with quantum efficiency, but given enough light, they can provide the resolution.
Hyperspectral imaging is a technique that will always provide maximum performance over a broad range of spectral data, but it accomplishes this at maximum complexity and cost for applications that may not require a full system. By zeroing in on a limited set of variables that best suit an application, multispectral imaging is an effective alternative to reduce cost and data and integration complexity — while still enabling rich image data and enhanced contrast.
Enabled by fast CMOS cameras, LED lighting, and optical filters, multispectral imaging can be implemented within the confines of a standard machine vision inspection system.
Meet the author
Steve Kinney is director of training, compliance, and technical solutions at Smart Vision Lights. Prior to his current role, Kinney held positions at PULNiX, Basler, JAI, and CCS. He is a current member of the A3 board of directors and is a previous chairman of A3’s camera link committee; email: steve.kinney@smartvisionlights.com.
/Buyers-Guide/Smart-Vision-Lights/c17499