Full company details
VIGO Photonics
 Poznanska 129/133
05-850 Ozarow Mazowiecki
Poland
Tunable Laser Spectroscopy Achieves New Peaks
Photonics Spectra
Aug 2021Already one of the simplest and most established forms of laser absorption spectroscopy, TDLAS systems and their components continue to evolve to meet new application demands.JEDRZEJ MIJAS, VIGO SYSTEM SA
The modern world, with the ever-growing impact of technology on humanity and the environment, requires us to thoroughly understand how our civilization works and what it produces — even the invisible matter such as gases that we emit into the atmosphere. There is a growing demand for more sensitive and efficient gas analysis solutions tailored to the challenges of industry and science. Concurrent with this is a constant need for basic research to develop increasingly sensitive detection and analysis devices.
Industry often needs to measure gas concentrations in ambient conditions. Medical professionals seek solutions to analyze human breath, in search of trace compounds that indicate disease. Environmental protection requires knowledge of exactly which substances are in the atmosphere and in what amounts. Such measurements are potentially taken on the ground, but also in situ. All of this requires spectroscopy systems that are stable, durable, easy to use, and that
allow detection of low gas concentrations with high precision and in real time (Figure 1).
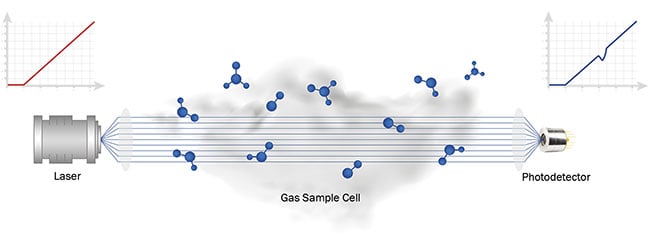
Figure 1. A typical layout for an infrared gas spectroscopy system. Courtesy of VIGO System SA.
Tunable diode laser absorption spectroscopy (TDLAS) is among the most widespread and established techniques for trace gas detection in laboratory settings, and it is well positioned to meet all of these demands. Further, the component and system technology underlying TDLAS continues to evolve to enhance current applications and extend the technique’s value to new end users.
Laser absorption spectroscopy
Generally speaking, laser absorption spectroscopy is suitable for a wide range of the challenges described. Such laser gas analysis systems consist of two main parts: a transmitter and a receiver. The transmitter is the laser system and all of its necessary control electronics. Its task is to emit light into a gaseous sample. The receiver consists of a readout system and a photodetector with all the necessary optical components. The receiver’s role is to record and display changes in radiation caused by the sample’s absorption of laser light.
The use of laser sources makes this spectroscopy method much more sensitive than nondispersive techniques because its higher intensity enables a more easily detectable light signal. Additionally, monochromatic laser light allows a more targeted match to the absorption spectra of the analyzed species.
Sophisticated variations of TDLAS systems that use external cavities or light emission modulation help to increase the sensitivity of this technique and continue to break records for what constitutes the lowest detectable concentrations.
Leveraging infrared radiation offers another advantage to laser absorption spectroscopy (Figure 2). The mid-infrared (MIR) region between 3 and 14 µm is especially promising for absorption spectroscopy due to the higher intensity of the region’s absorption lines compared to the intensity of those in the near-infrared between 1 and 3 µm. In some cases, a hundredfold increase in absorption peak intensity can be observed. This is evident, for example, when comparing peak intensity for CO
2 molecules at 2 or 2.7 µm with those at 4.2 µm. This means that the concentration of targeted species can be much lower and still create a noticeable signal difference.
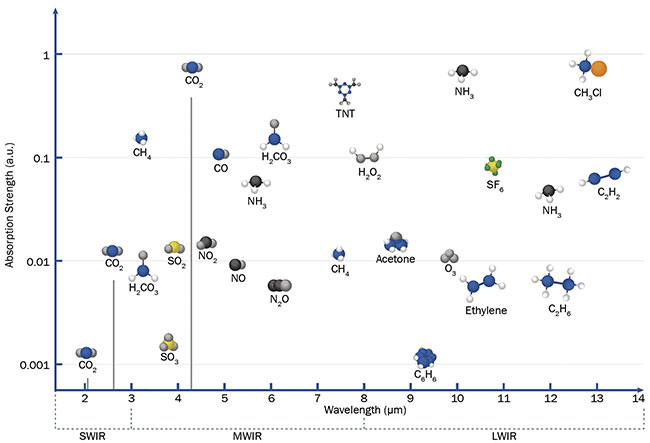
Figure 2. A comparison of absorption line strength for target molecules across various wavelength regimes. Courtesy of VIGO System SA.
Another advantage of MIR spectroscopy is the multitude of absorbing species in this region and the clear separation of lines for different molecules, which helps to achieve better detection selectivity.
TDLAS is a particularly promising variation of laser absorption spectroscopy. The technique involves tuning the
laser light source to a specific wave-length that corresponds to the absorption line of a molecular species or, in some cases, sweeping the laser light in a narrow spectral range that includes the absorption line. Modulation allows users to either fine-tune the laser to achieve maximum absorption or use sophisticated modulation techniques. TDLAS is better suited than competing techniques to
address many modern gas analysis
applications.
Alternative techniques
Photoacoustic spectroscopy is an
alternative to TDLAS that, rather than detecting a light signal altered by absorption, detects an acoustic wave induced
by absorption. Variations, such as quartz-enhanced photoacoustic spectroscopy, provide high sensitivity, are insensitive to the wavelength used, and require no photodetectors except to support control functions. However, such devices are sensitive to external acoustic interferences, which excludes their use in more physically demanding environments, such as in industrial or outdoor applications. Their usefulness is also significantly limited when analyzing low gas pressures, because the acoustic waves are simply less able to propagate.
Another competing technique is cavity ring-down spectrometry (CRDS). Here, a modulated laser signal enters a cavity and begins to cross it repeatedly, with a portion of light leaving the cavity after each pass. Measuring these outgoing light portions creates the so-called ring-down curve, the decay of which provides insights into the concentration of a gaseous species under analysis. CRDS allows the detection of extremely low gas concentrations. Unfortunately, its sensitivity has limited utility outside of the lab. The cavity needs to be very precisely manufactured and adapted to the laser operating mode, which increases the technology’s price and time to market. Maintaining cavity stability is also crucial, but this is challenging to ensure in demanding environments. Moreover, CRDS devices require precise calibration that is not always possible to perform and maintain in field applications.
TDLAS achieves comparable sensitivities to these competing techniques, but it is better suited for more rugged operations outside the laboratory. The laser and detector can both be temperature-stabilized, which ensures resistance to changing environmental conditions. There is no need for a cavity, but if the application demands one, the cavity can have much wider tolerances for alignment, vibration, and other changes in ambient conditions compared to conventional CRDS.
A TDLAS device is simple and has few parts, which ensures easy assembly and use. Overall, TDLAS systems are uncomplicated, effective, and flexible. Further, the increasing availability of infrared lasers, commercial cavity designs, and infrared detectors ensures that the technology can be constantly advanced to address a widening range of applications.
Tuning into TDLAS
The operation principle of TDLAS is described by the Beer-Lambert-Bouguer law, which connects the intensity of absorbed light with the type and concentration of molecules, as well as the optical path through the sample:
I(λ,x) = I
0(λ) exp (−σ(λ)Nx).
This formula permits clear evaluation
of the factors affecting the device’s
sensitivity.
The system design encompasses a laser emitting high-intensity light to illuminate the sample, a sensitive detector able to distinguish small changes in the detected optical signal in real time, and the longest optical path possible within a reasonably sized device. A high-absorption cross section is possible by employing an MIR laser, and this also generally helps to achieve the desired sensitivity. The simplest TDLAS setup is shown in Figure 3.
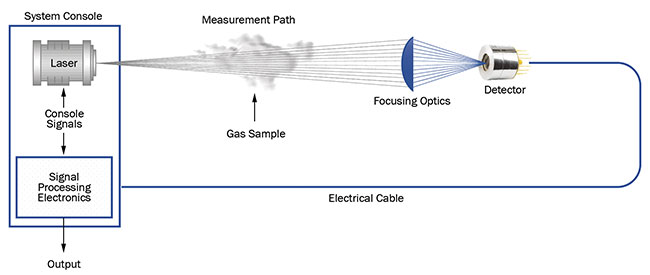
Figure 3. The layout for a typical tunable diode laser absorption spectroscopy (TDLAS) setup. The system console used to control the light source
and detector readout is clearly visible. Courtesy of VIGO System SA.
The very name of the TDLAS technique indicates the use of a tunable laser diode. Leveraging devices operating in the MIR further offers the benefits of that region’s higher absorption lines. Currently, the most popular IR light sources for TDLAS are distributed feedback diode lasers, namely quantum cascade lasers (QCLs) and interband cascade lasers (ICLs). These devices can be tailored to exactly match the desired central wavelength and, equally important, allow temperature and current changes to modulate the emitted wavelength or sweep across the entire absorption line.
Temperature tuning, due to its slow reaction time, is used to stabilize the laser light around the central wavelength, after which a rapid current modulation is introduced. Naturally, to control and modulate the light targeting the sample, a suitable steering console with appropriate electronic devices is needed. Recent advancements in the
fabrication of QCLs and ICLs have converged with the development of specialized epitaxy foundries to increase the cost-effectiveness of these light sources.
As the Beer-Lambert-Bouguer law indicates, device sensitivity can be enhanced by increasing the optical path through the absorbing sample. Often this is achieved by introducing an external
cavity. A simple yet very powerful technique for achieving this is multipass spectroscopy (Figure 4).
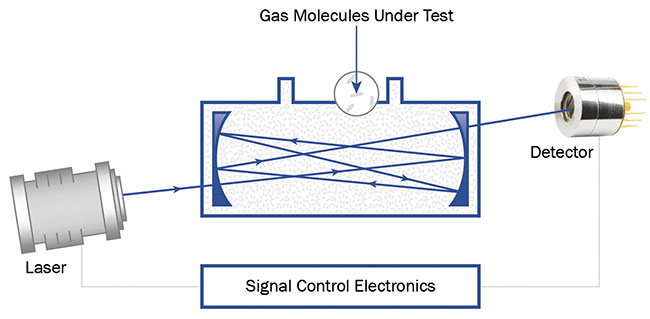
Figure 4. The layout of a typical multipass spectroscopy system. Here, a Herriott cell is used; however,
other cell designs are possible. Courtesy of VIGO System SA.
This technique simply extends the optical path via a carefully designed cavity, where — as the name implies — the light beam travels through the sample multiple times before hitting the detector. The gas sample is enclosed in the cavity.
Numerous layouts of the multipass cavity are available. The most common are White or Herriott cells, which are tubular in shape and have mirrors at either end to reflect the laser beam in such a way to allow the highest possible optical path within the cavity. Such cells are commercially available and allow both rapid prototyping and the most cost-effective manufacturing possible. Other, more sophisticated cavity designs, such as circular or vertical configurations, enable optical paths that measure hundreds of meters in length through an analyzed sample — all within a tabletop or even a portable instrument.
In outdoor instruments used for industrial or environmental monitoring, an open light path, even without a cavity, may be sufficient. Regardless, it is important to reduce the uncertainty of the read signal by modifying the data processing technique. To achieve this, it is vital to introduce modulation to the light source.
Modulation techniques
The most common modulation techniques are direct absorption spectroscopy and wavelength modulation spectroscopy. Electronic demodulation of the received signal allows for the elimination of random noise and improves the lowest detectable concentration.
Direct absorption spectroscopy is the simpler modulation technique. Its modulation period (in terms of the wavelength emitted) is much wider than the absorption profile chosen for measurement.
As a result, the recorded changes of
emitted light intensity over time contain two symmetrical dips, which represent the wavelength passing through the
absorption profile (Figure 5). The dip in amplitude can help to calculate the concentration of molecular species and illustrates why direct absorption spectroscopy is one of the simplest modulation techniques.
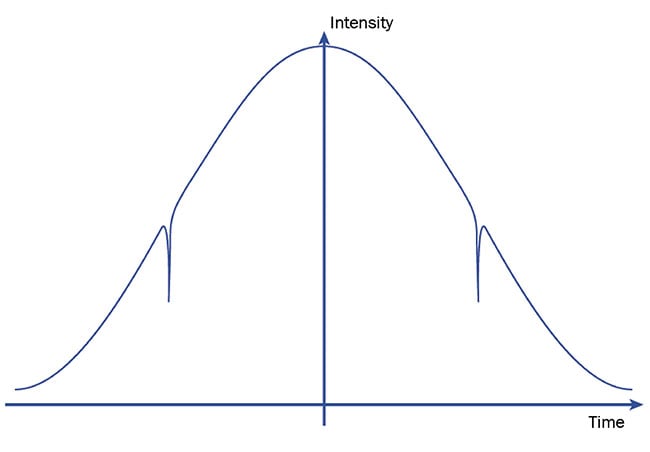
Figure 5. Sample detector signal intensity as a function of time in direct absorption spectroscopy.
Note the dips in intensity corresponding to where the laser sweeps through an absorption wavelength. Courtesy of VIGO System SA.
Wavelength modulation spectroscopy differs from direct absorption spectroscopy primarily due to the range of its wavelength modulation. Here, a narrower modulation period is superimposed
on the absorption profile in various positions. Depending on the alignment, it is possible to register the signal at the same frequency as the modulation (1f signal)
or at a double frequency (2f signal)
when aligning the modulation with the absorption profile peak (Figure 6).
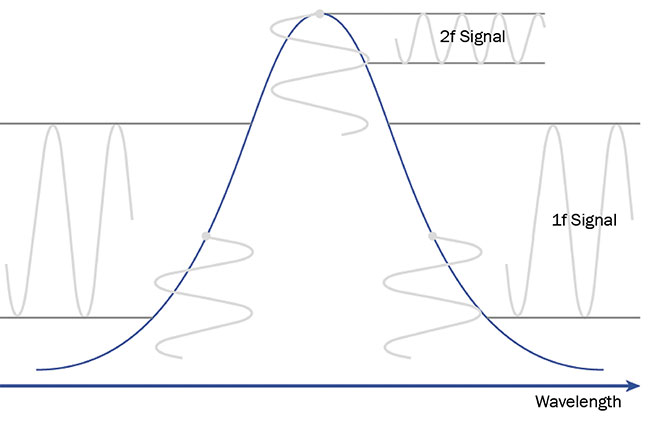
Figure 6. The principle of wavelength modulation spectroscopy. The absorption profile (blue). The wavelength modulation is superimposed in relation to the profile — marked by vertical sine signals (gray). The modulation results in 1f or 2f signals, depending on the modulation placements. Courtesy of VIGO System SA.
After demodulation, the registered
absorption peak differs from 1f to 2f
signals. As can be seen from the exemplary signal curves in Figure 7, it is
more advantageous to use the 2f signal because the resulting curve has a clearly shaped peak, the height of which can be interpreted as a relative absorption intensity — similar to direct absorption spectroscopy (Figure 7).
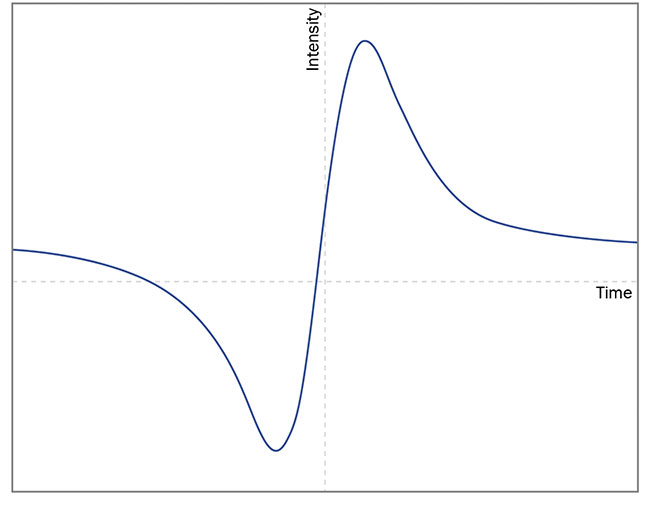
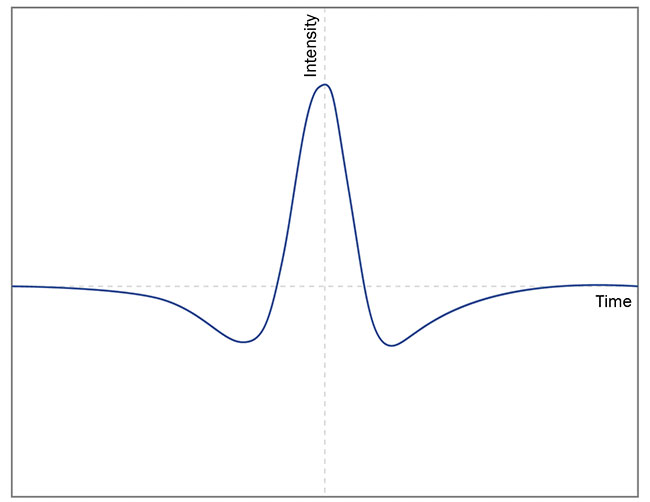
Figure 7. The differences between exemplary 1f (top) and 2f (bottom) signals registered in wavelength modulation spectroscopy. Courtesy of VIGO System SA.
Detectors are key
High-performance light detectors
are a key part of all of these spectroscopy systems. The spectral and frequency response of the detector should carefully match that of the laser source and modulation technique to ensure the best signal-to-noise ratio. Photoconductors
and especially photodiodes are particularly suitable for this task due to their high detectivity and low time constant, which enables real-time operation.
Another key parameter of detectors to
be considered is the linearity of the
detector response, which can simplify digital conditioning of the signal. Thermoelectric cooling or temperature stabilization is frequently used to ensure stability of the readouts. The sophisticated fabrication of detectors, along
with wedged windows and anti-reflective
coatings can all help to solve inherent TDLAS issues, such as fringing. The advent of environmentally friendly,
RoHS (Restriction of Hazardous Substances)-compliant detectors made from III-V materials has extended the
application range of detectors, as it
allows development of TDLAS systems for medical applications.
The list of potential applications of TDLAS systems is long, and new ones are constantly emerging. Environmental research, monitoring, and protection
require constant measurement of emissions from industrial sites and other
locations.
The automotive sector is interested in TDLAS-based exhaust-gas control systems to reduce emissions of hazardous molecular species. Possibly the most fascinating application, however, is the measurement of biomarkers in the air
exhaled by humans. Easy-to-use, affordable TDLAS devices with enough sensitivity to detect trace gases may serve
as a perfect, noninvasive tool for screening and early diagnosis of cancer and other diseases.
With such a broad list of potential
applications driving both demand and
advancements in hardware, TDLAS
systems are more than ready to be
commercialized and applied en masse
to contribute to a better world.
Meet the author
Jedrzej Mijas is a technical support and sales engineer at VIGO System SA. During his studies at the University of Warsaw, where he received a Master of Science, Mijas gained broad theoretical knowledge of and practical experience in optics, focusing on various spectroscopic methods.