Planned missions from NOAA, NASA and the European Space Agency will include next-generation multispectral imagers, IR sensors and lidar to gather data on aerosols, clouds, volcanic emissions and sea ice.
From tracking ash plumes from volcanic eruptions to measuring water vapor, multispectral imagers, IR sensors and lidar systems in space are yielding critical data leading to better forecasting models and long-term insights into global climate change. In the past decade, the National Aeronautics and Space Administration (NASA) and the National Oceanic Atmospheric Administration (NOAA), along with their international partners, have embarked on a number of critical missions that are helping answer the questions about how clouds and aerosols form, evolve, and affect water supply, climate and weather.
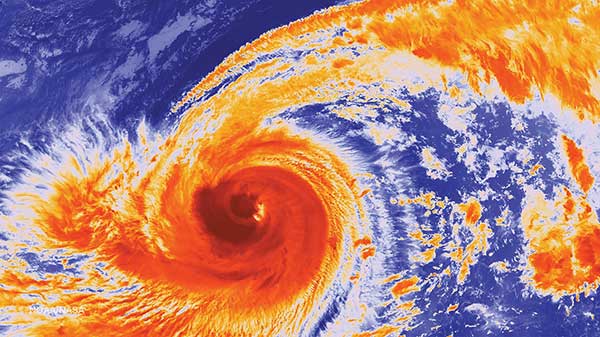
Taken with the high-resolution infrared instrument, the (CrIS) on the Suomi NPP satellite, this image shows the deep convective core of Typhoon Phanfone as it generated sustained winds of 125 mph. Here, the storm is 650 miles south of the Japanese mainland and heading on a course that will eventually place it just off the coast.
Today, NOAA and NASA are in the midst of updating the nation’s satellite programs: the Joint Polar Satellite System (JPSS) and the Geostationary Operational Environmental Satellite-R Series (GOES-R). Together, they represent the two biggest operational programs for Earth remote sensing.
The first of the next-generation polar orbiting satellites, Suomi National Polar-orbiting Partnership (Suomi NPP), launched in 2011 as a bridge from legacy satellites to the launch of JPSS-1 set for early 2017, which will provide observations until nearly 2040. On board Suomi NPP (and JPSS-1) are advanced operational sounders that provide highly accurate, detailed atmospheric temperature and moisture observations for weather and climate applications. A high-spectral resolution infrared instrument, the Cross-track Infrared Sounder (CrIS), measures the three-dimensional structure of atmospheric temperatures, water vapor and trace gases in the mid- to long-IR part of the spectrum, from 3.9 to 15.4 µm, providing more than 2,000 infrared spectral channels at an improved horizontal spatial resolution and measures temperature profiles with a vertical resolution approaching 1 K.
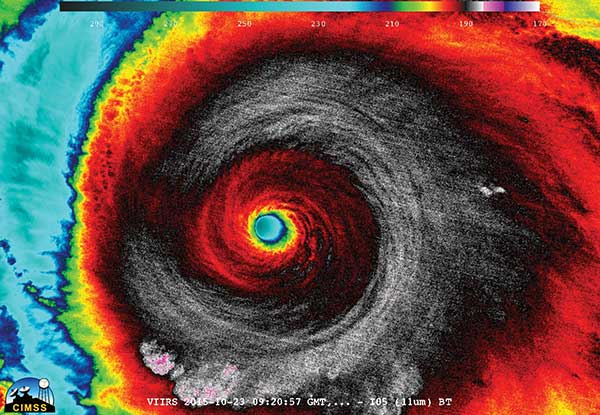
Hurricane Patricia, the strongest land-falling Pacific hurricane in recorded history, is shown approaching Mexico’s Pacific coast. The VIIRS instrument aboard Suomi NPP captured an infrared image of the typhoon. Courtesy of William Straka III, University of Wisconsin-Madison, CIMSS.
This information is proving to be a powerful tool for forecasters, allowing for short-term weather “nowcasting” and longer-term forecasting.
“The most important function of polar operational weather satellites is to feed weather prediction models with global three-dimensional structures of atmospheric temperature and moisture and other parameters that enable prediction skill to produce confident three- to seven-day-ahead forecasts of potentially severe weather, critical to the protection of life, property and the economy,” said Mitch Goldberg, senior scientist for NOAA’s JPSS program.
In addition to forecasting, CrIS is gathering data on gases in the atmosphere useful for predicting climate change.
“The infrared spectrum has many absorption lines, where each line has a different sensitivity to atmospheric gases, such as CO2, CO, CH4, O3 [and] H2O,” Goldberg said. “The CrIS sensor is designed to observe the infrared spectrum between 650 and 2550 cm−1 wave numbers with a spectral resolution of 0.625 cm−1 providing about 2,000 observations, which are often referred to as channels. The information content is very high to extract very accurate atmospheric temperature and water vapor from the observed infrared radiances.”
CrIS’ capabilities far exceed those of the legacy High-Resolution Infrared Radiation Sounder (HIRS), which had only 19 channels and yielded coarse and error-prone atmospheric soundings, according to Goldberg.
A second instrument on Suomi NPP and JPSS-1, the Visible Infrared Imaging Radiometer Suite (VIIRS), combines the radiometric accuracy of the Advanced Very High Resolution Radiometer (AVHRR), currently flown on the NOAA polar orbiters with the high spatial resolution of the Operational Linescan System flown aboard the Defense Meteorological Satellite Program.
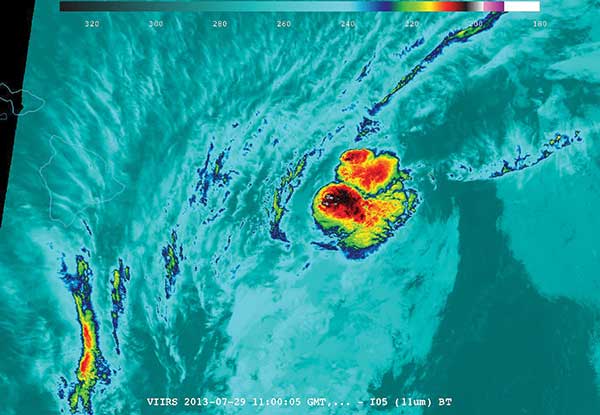
As Tropical Storm Flossie approaches Hawaii, the Visible Infrared Imaging Radiometer Suite (VIIRS) instrument captures the bright glow (right) from two volcanoes on the big island poking through the clouds in this satellite imagery. Courtesy of William Straka III, University of Wisconsin-Madison, CIMSS.
VIIRS has a much higher spatial resolution than any other imager now in orbit. A key feature of the instrument is its unique day/night band, which provides visible imagery using lunar illumination at night, as well as its design, which maintains the spatial resolution across the entire swath width of 3000 km. Its resolution near nadir is 375 m for the five imaging channels, and 750 m for the 17 moderate resolution bands.
“The VIIRS imagery, because of its relatively high spatial resolution and twice-per-day daily coverage, allows for detection for fires (small and large), aerosols, smoke, sea ice edge, vegetation fraction and clouds — cloud fraction, height, thickness, cloud phase and visibility,” Goldberg said.
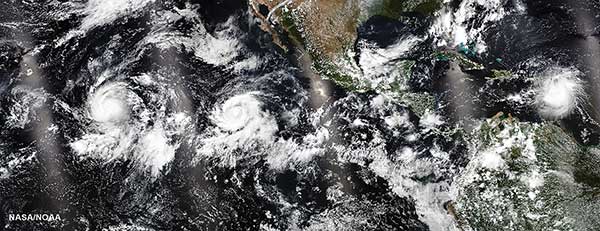
Suomi NNP VIIRS captured three tropical storms in the Western Hemisphere on the evening of Aug. 27, 2015. Storms from the west to the east include Hurricane Ignacio in the central Pacific, Hurricane Jimena in the eastern Pacific, along with Tropical Storm Erika in the Atlantic Caribbean Sea. Courtesy of NOAA.
Raytheon Co. built the current VIIRS instrument and delivered a second VIIRS sensor for JPSS-1. The company is currently building a third VIIRS unit for JPSS-2, scheduled for launch in 2021.
Atmospheric measurements of the Western Hemisphere
The second of the two primary operational programs for Earth remote sensing is the GOES program. The first satellite in the long-anticipated GOES-R series is planned for launch in October, and is expected to remain operational until 2036, at a cumulative cost of more than $7 billion. The satellite will provide uninterrupted atmospheric measurements, lightning data and space weather monitoring to provide vital atmospheric, hydrologic, oceanic, climatic and solar data.
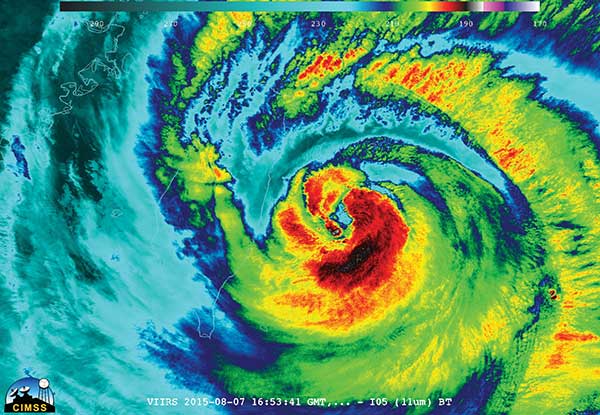
NOAA/NASA’s Suomi NPP satellite passed over powerful Typhoon Soudelor at night when it was headed toward Taiwan. The VIIRS instrument aboard the satellite captured this nighttime infrared image of the storm. Courtesy of William Straka III, University of Wisconsin-Madison, CIMSS.
The program is “a major advancement to our existing geostationary capability with a multispectral, high resolution imager,” said Fred Moshary, of NOAA-CREST (Cooperative Remote Sensing Science and Technology) Center’s Optical Remote Sensing Laboratory and a faculty member at the City College of the City University of New York.
Images of weather patterns and severe storms will come in as frequently as every 30 seconds, improving short-term weather forecasts and severe storm watches, maritime forecasts and seasonal predictions.
“With both Earth-facing and solar-facing instruments, GOES monitors not only the Earth, but the sun and solar environments as well,” said Steven Goodman, GOES-R series senior scientist at NOAA.
While the satellites are often referred to as “weather satellites,” they’re actually true environmental satellites, just as the name implies. Some of the nonmeteorological parameters they monitor include geomagnetic storms, solar radiation storms, volcanic ash plumes, wildfire, sea surface and land surface temperatures and aerosols.
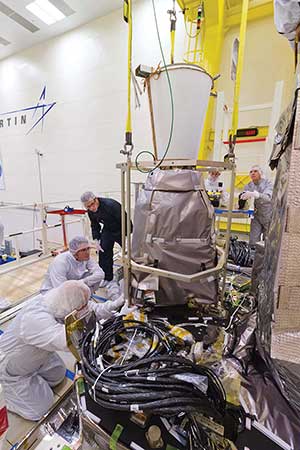
The GOES-R Geostationary Lightning Mapper (GLM) is installed onto the GOES-R spacecraft at Lockheed Martin in Littleton, Colo. The instrument was developed and built by Lockheed Martin Advanced Technology Corp. in Palo Alto, Calif. Courtesy of Lockheed Martin.
Among the new instruments aboard GOES-R is the Geostationary Lightning Mapper (GLM). GLM is a single channel, near-IR optical transient detector that picks up the very short optical signals at the cloud top from lightning, building on the heritage capabilities of NASA’s Lightning Image Sensor (LIS) on the Tropical Rainfall Measuring Mission, completed in April 2015. The instrument observes rapid changes in optical emissions, sampling every 2 ms at the 777.4 neutral oxygen emission line, which emits about 10 percent of the total lightning energy.
“The GOES-R GLM, and other international lightning mappers planned for geostationary orbit later this decade by Europe and China, will extend the LIS climatology for the next 20 years,” said Goodman.
Forecasters will gain a consistent and uniform view of lightning activity over the Western Hemisphere, at a spatial resolution of 8 km over the Americas, providing information on intensifying storms that will aid in forecasting and warning of severe storms and tornado activity.
The crown jewel aboard GOES-R is the Advanced Baseline Imager (ABI), offering higher spatial resolution and faster imaging than the prior GOES imager. ABI has 16 spectral bands in all, including 0.47 μm for aerosol detection and visibility estimation; 0.865 μm for aerosol detection and estimation of vegetation health; and 1.378 μm for the detection of very thin cirrus clouds.
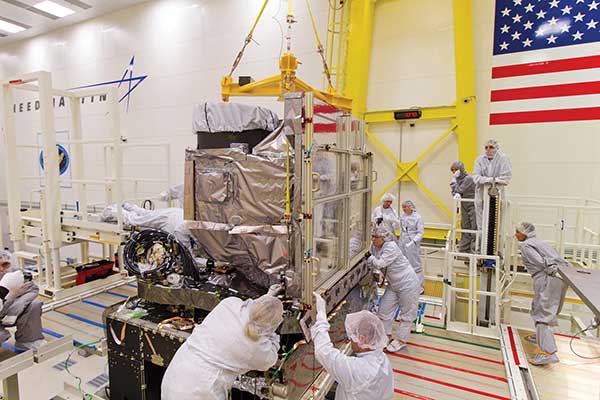
The GOES-R Advanced Baseline Imager (ABI) is installed onto the GOES-R spacecraft at Lockheed Martin in Littleton, Colo. ABI resides on the Earth-Pointing Platform of the spacecraft, along with the Geostationary Lightning Mapper. ABI was developed and built by Exelis Inc. in Fort Wayne, Ind. Courtesy of Lockheed Martin.
Additional bands will yield important data on midtropospheric water vapor, sulfur dioxide levels in the atmosphere and volcanic dusts that contain sulfuric acid aerosols, allowing scientists to see “spectral signatures” of key environmental features. The added bands make it possible for simple true or false color readings that can distinguish clouds from snow in daytime imagery, and color imagery that identifies smoke and ash, as well as new details on separating low stratus clouds from fog. There will also be improvements in radiometric performance, image navigation and registration.
“From its view in geostationary orbit, the new advanced capabilities of GOES-R offers a 3× increase in spectral resolution allowing for new and improved [data], a 4× increase in spatial resolution allowing for a more detailed view of the atmosphere, land and ocean, and a 5× increase in the refresh rate for viewing rapidly changing phenomena,” Goodman said.
With the new 30-second refresh capability, forecasters can better track rapidly changing weather phenomena such as severe storms, smoke and dust plumes, and tropical cyclones.
Meteorologists’ fascination with clouds stems from the complex role they play, trapping infrared radiation emitted by the earth and reflecting solar radiation back to space. Similarly, suspended small particles in the air called aerosols also factor heavily in the Earth’s radiation balance directly through their interaction with radiation, as well as indirectly due to their role as condensation nuclei in cloud formation processes.
Probing the troposphere
Beyond hyperspectral and multispectral imaging systems—both considered passive sensors—there’s lidar, an active sensing technique and one of the most useful for studying the earth’s atmosphere. With its inherent small laser divergence, its small beam can be used to probe the troposphere. The short pulse length of the laser provides exceedingly high resolution, while its monochromatic nature allows for both narrow band filtering and high signal-to-noise ratio. This allows for the measurement of critical constituents and properties such as ozone, water vapor, density, clouds and aerosols.
“Lidar is great for getting vertical information, since it involves a measurement of time, which can be done very accurately, between transmission and return,” said Jack A. Kaye, associate director for research at NASA’s Earth Science division. “It gets very good vertical resolution because of the ability to measure the time so accurately. For clouds, it can see very thin layers — and note that getting accurate height information is unusual because most passive instruments can provide little or no height information — and even be able to measure multiple layers.”
Early space-based lidar missions included the LITE (Lidar In-Space Technology Experiment) instrument aboard the space shuttle in 1994, followed by the short-lived ICESat (Ice, Cloud and land Elevation Satellite), for measuring ice sheets. More recently, NASA launched the Cloud-Aerosol Transport System (CATS) to provide range-resolved profile measurements of atmospheric aerosols and clouds from the International Space Station last year.
One of the most critical lidar missions is the Cloud-Aerosol Lidar and Infrared Pathfinder Satellite Observation (CALIPSO) mission, launched in 2006. CALIPSO has generated reams of data that researchers are using to construct 3D models of the atmosphere.
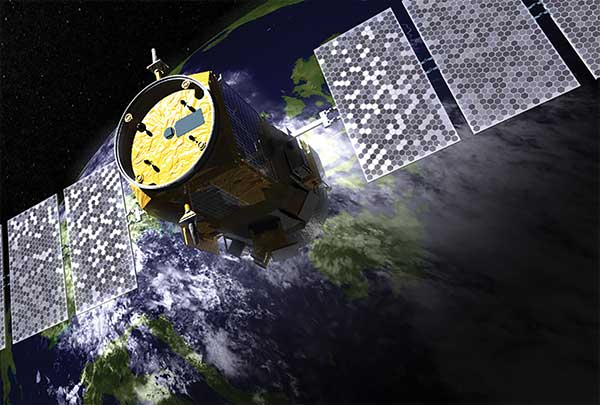
The main instrument on CALIPSO takes measurements of natural processes via laser light using lidar. CALIPSO’s purpose is to determine the distribution of aerosols and thin clouds around the world. Coupled with its sibling satellite CloudSat, CALIPSO is helping scientists develop never-before-seen views of Earth’s atmospheric structure and behavior. Courtesy of NASA.
“With CALIPSO you’re able to get into the troposphere. Passive sensors have a difficult time with the lower troposphere, but here we’re gaining high vertical resolution images,” said Pat McCormick of Hampton University, a partner university within NOAA’s CREST Center. McCormick pioneered the use of lidar in the 1960s and has led or been involved with many prominent lidar initiatives, including LITE, and the CALIPSO mission, still running after nearly 10 years in orbit.
On CALIPSO, the lidar measures the cloud cover with green and infrared laser light and also detects backscatter from aerosols. Twenty laser pulses are sent every second, each only 20 billionths of a second long, leading to a near-endless stream of profiles. By examining depolarized backscatter, high-altitude cirrus clouds of ice particles can be measured. Incorporating the radar data from
CloudSat, McCormick and his team can measure even very optically thick clouds over all of the troposphere. CALIPSO also tracks aerosol layers like those of desert dust blown off the surface of the Saharan or Gobi deserts ¬— data that’s crucial for understanding climate change.
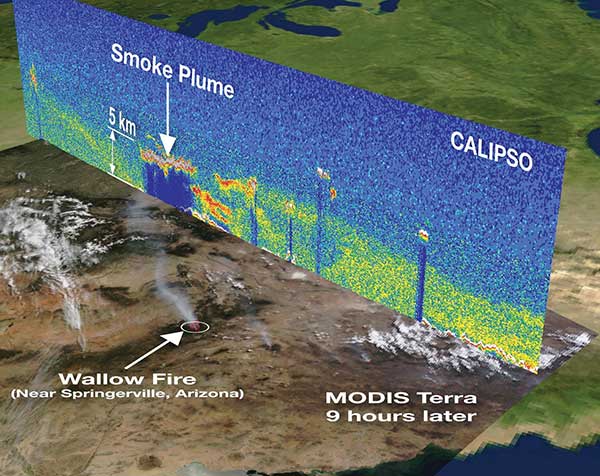
A CALIPSO vertical profile from space shows the smoke plume from wildfires raging in Arizona on June 3, 2011. It is overlaid on an image captured by the Moderate Resolution Imaging Spectroradiometer (MODIS) instrument on the Terra satellite nine hours later. Courtesy of NASA.
“With dust from the Sahara you’re locating it, spatially measuring it and then those data go into various transport and climate models,” McCormick said.
Lidar is also useful for measuring the atmospheric aerosols produced by volcanic eruptions, he said, noting that the research community is still mulling the impact of events like the eruption of Mount Pinatubo in the Philippines in 1991. The resulting stratospheric aerosol cooled parts of the earth three-quarters of a degree and warmed the stratosphere significantly the year after the eruption, causing scientists to revamp and validate their climate models.
One of the key lessons from CALIPSO was the unexpected lifetime of the Nd:YAG laser, which, after literally billions of shots, is still going strong. Future improvements to lidar technology, according to McCormick, will involve the use of holographic gratings to split the laser beam into different patterns.
“Since CALIPSO points at nadir in its orbit, a curtain file of backscattered data is produced during each orbit,”
McCormick said. “You don’t get contiguous data between orbits unless you get into scanning.”
This feature will be included on an altimeter on the upcoming ICESat-2 for measuring ice sheet balance.
High-spectral resolution lidar on EarthCARE
The European Space Agency (ESA) is picking up where CALIPSO left off, with the planned launch of the Earth Explorer Core mission EarthCARE (Earth Clouds, Aerosols and Radiation Explorer) in conjunction with the Japanese Aerospace Exploration Agency (JAXA) in 2018. Like CALIPSO, the mission’s objective is to collect data needed for a better understanding of the interactions between cloud and aerosol processes that regulate Earth’s climate.
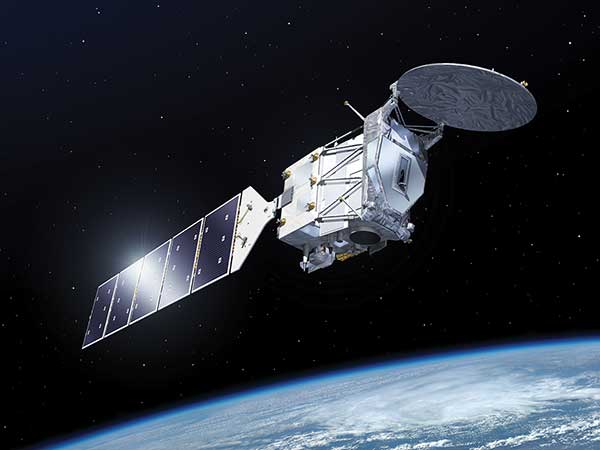
EarthCARE — the largest and most complex Earth Explorer mission to date — is being developed as a joint venture between the European Space Agency (ESA) and the Japan Aerospace Exploration Agency (JAXA). Courtesy of ESA.
The payload will consist of a high-spectral-resolution atmospheric lidar (ATLID), a cloud-profiling radar with Doppler measurement capabilities, a multispectral imager and a broad-band radiometer. ATLID will deliver extinction, backscatter and depolarization profiles at 355 nm. The high-spectral-resolution techniques allow for independent measurement of extinction and backscattering without prior assumptions. In contrast, conventional lidar instruments, such as those aboard CALIPSO, rely on an assumed ratio of extinction to backscatter in the retrieval algorithm, which can lead to high uncertainties in the retrieved geophysical parameters.
“ATLID will help characterize the global four-dimensional distribution of aerosols and thin clouds,” said Ulla Wandinger of the Institute for Tropospheric Research (TROPOS), in Leipzig, Germany, who is a member of the EarthCARE Mission Advisory Group.
Thick clouds cannot be fully penetrated by the lidar signal, which is why EarthCARE will include a radar system that can penetrate the clouds and allows for re-creation of the vertical structure of the cloud, as well as identifying precipitation. The combined data analysis will lead to a full characterization of the cloud structure and aerosol profiles on a global scale, she said.
The vertical structure of clouds and aerosols determine their radiative impact — how strongly they are reflecting incoming solar radiation, which has a cooling effect on the atmosphere. The structure also offers a window into how strongly they are reflecting thermal infrared radiation emitted from the Earth’s surface back to the Earth — which has a cooling effect.
“Clouds and aerosols are highly variable in space and time as well as in their scattering properties,” Wandinger said. “They influence the radiation budget of the earth by directly interacting with the incoming short-wave and the outgoing long-wave radiation. Depending on their optical properties they can either cool or warm the atmosphere.”
There is a multitude of indirect effects and feedbacks following the interaction of clouds and aerosols, making it very difficult to estimate the global radiation impact of clouds and aerosols with much accuracy, she said. In essence, they represent the largest uncertainty in climate modelling.
EarthCARE will address this, and has the added capability of discerning aerosol types such as marine aerosols, dust, or biomass burning smoke.
“Through the analysis of the backscattered light, the targets can be identified as either ice or liquid cloud or aerosol,” said Tobias Wehr, of ESA’s Atmospheric Section (EOP-SMA), Mission Science Division.
“Once the vertical distribution of aerosols, ice and liquid particles (clouds) are known, the heating/cooling at each atmospheric level can be accurately calculated with ‘radiative transfer models’ and double-checked against the collocated observations of the EarthCARE broadband radiometer. By this, the effect of clouds and aerosols on radiation will be determined,” Wehr said.
“Only lidar allows us to investigate, in detail, the extension and the radiative effects of … thin ice clouds, volcanic ash layers, smoke and dust layers independent of whether these objects are located above dark surfaces like the ocean or bright reflectors like low water clouds and deserts,” Wandinger said.
Missions Will Focus on Pollution Levels, Lightning and Ozone
International Space Station/LIS (2016) — NASA will fly the Lightning Imaging Sensor (LIS) on the International Space Station later this year. LIS is a follow-up to the predecessor instrument flown aboard the Tropical Rainfall Measuring Mission with
Japan from 1997 to 2015. Its orbit will over-lap in time with the flight of the new Geostationary Lightning Mapper (GLM) aboard NOAA’s GOES-R satellite, to be launched later this year, offering complementary data.
International Space Station/SAGE III (2016) —The Stratospheric Aerosol and Gas Experiment (SAGE III) will fly aboard the International Space Station, measuring vertical profiles of ozone, aerosols, water vapor and nitrogen dioxide using solar occultation. SAGE III will follow an orbit that was close to the first two SAGE missions.
TEMPO (launch TBD, though no later than 2023) — NASA will use optical measurement to study distributions of ozone and other pollutants. Though a specific satellite platform and launch haven’t been confirmed, the instrument will be placed into a geostationary orbit over the U.S. to monitor the hourly evolution of pollution events over the U.S. and Central and South America.
ADM-Aeolus: Profiling Wind on a Global Scale
ESA’s ADM-Aeolus wind mission, set for launch in 2017, will incorporate a direct detection Doppler wind lidar to measure wind profiles globally from space. Named after Aeolus, who in Greek mythology was appointed “keeper of the winds” by the gods, the Aeolus satellite carries one large instrument, the Atmospheric Laser Doppler Instrument (ALADIN), which consists of three elements: the laser transmitters, a Mie and Rayleigh backscattering receiver assembly and a Cassegrain telescope with a 1.5 meter diameter.
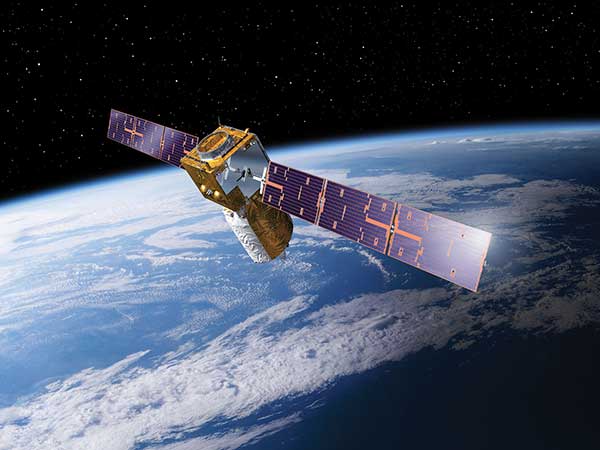
ADM-Aeolus will be the first space mission to acquire profiles of the wind on a global scale. The satellite carries an innovative Doppler wind lidar to probe the atmosphere and acquire global wind profiles up to an altitude of 30 km above the ground. Courtesy of ESA.
The transmitter architecture is based on a 110-mJ diode-pumped, frequency tripled Nd:YAG laser operating in the UV at 355 nm. The received backscatter signal is composed of frequency-broadened molecular signals and frequency narrow particle signals, whose center frequencies relative to the laser’s emitting frequency are directly linked to wind velocity. The Raleigh receiver employs a dual filter Fabry-Perot interferometer and a CCD.
Wind speed is determined by the difference in the signal amplitudes from the two filters with respect to the laser-emitting frequency. The Mie receiver employs a Fizeau interferometer and a CCD. Wind speed is determined by the fringe centroid position on a CCD to better than a 10th of the resolution. The CCD signals are then moved to an accumulation CCD, applying time-gating, which allows the detection of the wind in 24 vertical layers.
The molecular channel signal processing provides horizontally projected, single line-of-sight wind profiles along the satellite track from about 30 km altitude down to the surface (clear air) or down to optically thick clouds. The particle channel provides wind profiles through optically thin cloud and aerosol layers and on top of optically thick layers. The wind profiles come in nearly in real-time and directly assimilated by weather models, improving the accuracy of weather forecasts. The findings will advance the understanding of atmospheric dynamics and processes related to climate variability. Atmospheric backscatter and extinction coefficient profiles will be used to detect and characterize aerosol and cloud layers.