NIRS and Chemometrics Offer Insights Into Earth’s Surface
Ground-based NIR reflectance measurements are collected to develop calibrations that are later applied to hyperspectral data, offering the means to extract quantitative information about the Earth’s surface.
BRIAN CURTISS, ASD INC.
When applied to hyperspectral remote sensing images, the techniques of near-IR spectroscopy (NIRS) and multivariate chemometric calibrations, such as partial least squares regression, enable quantitative mapping of the properties of Earth’s surface. NIRS techniques and chemometrics have been used since the widespread availability of mainframe computers in the 1960s; in the 1980s, the U.S. Department of Agriculture heavily promoted NIRS and chemometrics for the analysis of animal feeds and forage.

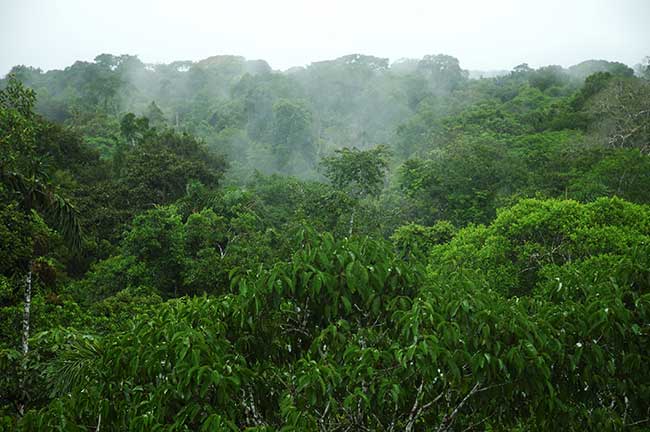
Hyperspectral imaging can be used to create maps of vegetation biochemical properties for even the most remote geographic areas on the planet.
At the same time, Alexander Goetz, a pioneer in the fields of remote sensing and imaging spectrometry, envisioned hyperspectral remote sensing, and the first imaging instruments were flown by NASA’s Jet Propulsion Laboratory. A few years later, a research group led by John Aber at the University of Wisconsin’s Environmental Remote Sensing Center — aware of the department of agriculture’s work — was the first to apply chemometric techniques to hyperspectral imagery by demonstrating the ability to map forest canopy nitrogen and lignin concentrations on the landscape scale. This enabled a new generation of landscape-scale ecosystem models.
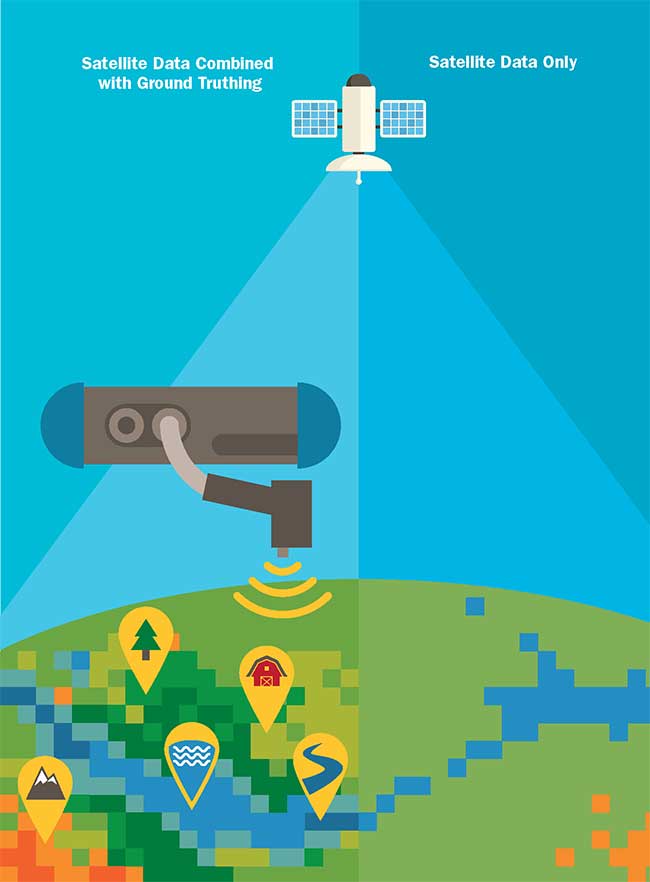
Since then, the use of NIRS chemometrics and hyperspectral imaging techniques to quantitatively map a wide range of properties, such as plant canopy and soil carbon, has been further developed, tested and validated. Applying NIRS chemometrics to hyperspectral images of the Earth’s surface consists of several steps. First, ground-based NIR reflectance measurements of materials with known physical and/or chemical properties are collected. This is known in the remote sensing industry as “ground truthing” (Figure 1).

Figure 1. Ground truthing is information that is collected on location. In remote sensing, ground truthing is important in order to relate image data to real features and materials on the ground. The collection of ground-truth data enables calibration of remote sensing data, and aids in the interpretation and analysis of what is being sensed. Courtesy of ASD.
The database is then used to develop the quantitative calibrations that are later applied to hyperspectral image data. Intermediate steps include the conversion of this data from the original radiance values to reflectance and the resampling of the ground-based reflectance measurements to match the spectral sampling and spectral resolution of the hyperspectral imager.
Matching image and spectra
In order to apply an NIRS chemometric calibration to a hyperspectral image, the image must first be converted from radiance to reflectance units. ENVI, one of the most commonly used image processing software packages for analyzing hyperspectral imaging, proves critical. The FLAASH (Fast Line-of-Sight Atmospheric Analysis of Spectral Hypercubes) add-on to ENVI is often used to perform this conversion.
Since water vapor varies across an image, the ENVI atmospheric correction module first determines column water vapor for each pixel and then performs corrections for scattering, spatially variable water vapor and other well-mixed atmospheric gasses (Figure 1). An additional step is usually carried out to polish the resultant reflectance spectra in order to remove any systematic artifacts in the computed reflectance spectra. As a last optional step, derived image spectra can be refined further by adjusting, on a per-pixel basis, the hyperspectral image spectra to match field spectra measured from known points in the image.
In contrast to hyperspectral image sensors, field reflectance spectrometers typically have reflectance values at over 2000 wavelengths. Because the goal is to use the reflectance spectra collected in the field to generate a calibration equation that can then be applied to hyperspectral images, field spectra must be resampled to match the wavelengths and band pass of the hyperspectral imaging sensor. A widely used tool for this task — the Spectral Library Resampling function — is included in the ENVI image processing package and takes as input parameters the known wavelength band centers of the hyperspectral sensor and one of three means to specify the sensor’s band pass values: 1) user-supplied filter function for each band; 2) full width half maximum values; or 3) If no other information is given, ENVI assumes critical sampling and uses a Gaussian model with a full width half maximum equal to the band spacings.
NIRS chemometric calibrations
Developing the NIRS chemometric calibration model involves calculating a regression equation based on the spectrally resampled, field-collected reflectance spectra and the known or measured properties of the material viewed when collecting the spectra. Field spectra should be collected from a range of targets that span the full variability encounters within the region over which the NIRS calibration will be applied. The most commonly used regression-based calibration methods include multiple linear regression, principal component regression and partial least squares. In general, the latter two techniques are better suited for calibrations applied to hyperspectral images because they make use of information contained across all wavelengths.
Several parameters are optimized and evaluated in developing a calibration model using either principal component regression or partial least squares regression: factors, loadings and scores. When choosing the number of factors (also known as principle components or eigenvectors), one should avoid incorporating too few factors or too many. If an insufficient number of variables are chosen, the prediction is not reliable because useful information has been left out. If too many are chosen, however, more uncertainty is included in the calibration set that results in errors in prediction. Scores are used to check the sample homogeneity and possible clusters, while loadings are used to interpret how the variables are weighted in principal component space.
Prior to application to the hyperspectral imagery, the validity of the derived NIRS chemometric calibration must be tested. Usually this is done by splitting the field-collected sample set into two groups — one group for calibration and the other for validation. If there are not enough samples, “leave-one-out” cross-validation can be performed; this means leaving one sample out, using the rest of the samples to build a calibration model, and then using the model to predict the one that was left out. This is repeated N times — N being the number of samples in the calibration dataset. The advantage of doing cross-validation is that the sample being predicted is not included in the calibration model. Chemometric software packages are available that provide all the functionality necessary to compute and validate the NIRS chemometric calibration equation.
Once the equation has been created and validated, it is then applied to the hyperspectral image data that was previously converted into reflectance units. The application of the NIRS calibration is simplified, as it is computed using field reflectance spectra that were previously resampled to match the wavelengths and band passes of the hyperspectral imager. Since the ENVI image processing package runs in the Interactive Display Language (IDL) environment, it is relatively straightforward to write a simple ENVI+IDL routine to apply the derived NIRS calibration equation coefficients to a hyperspectral image. The output of this routine is an image of property or abundance values for which the NIRS chemometric calibration was developed.
Uncovering the properties of tea
The quality and flavor of tea are controlled by several compounds measurable by NIRS: Amino acids in tea affect freshness and appearance; polyphenols primarily influence bitterness and astringency; and sugars affect sweetness. Researchers at the University of Twente in The Netherlands and Wuhan University in China demonstrated that calibrations for these three properties accurately determined hyperspectral imaging techniques.
While NIRS analysis of plant materials is typically carried out using dried and ground leaves, the use of remotely sensed hyperspectral images to create maps of vegetation biochemical properties requires that NIRS calibrations be developed using spectral measurements of the intact plant canopy.
In the 2013 study, NIRS calibrations were derived from reflectance spectra collected using an ASD FieldSpec spectroradiometer at three levels: dried and ground leaves, fresh leaves, and intact tea canopies measured in the field using ambient solar illumination. This is one of the first studies to show the viability of NIRS calibrations across a range of scales. Since water in fresh leaves results in strong absorption features throughout much of the NIR spectrum, which partially masks absorption features of other compounds, the calibrations derived from the fresh leaves had significantly lower accuracy than those derived from the dried and ground tea samples. Spectra collected from the intact tea canopy was even more complicated since factors such as soil background and canopy structure influence the measured spectrum, but the resultant calibrations were as good as or better than the fresh leaf calibrations. This is likely because field-measured full-canopy reflectance spectra are strongly influenced by canopy structural parameters such as leaf density, leaf and branching angles, and plant crown shape. These characteristics may, in turn, be correlated to the concentrations of the target biochemicals.

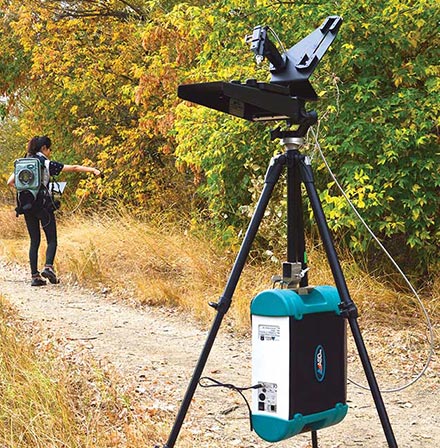
Collecting spectral data in the field using the ASD FieldSpec 4 and FieldSpec Dual Collection software system. Courtesy of ASD.
Overall, the authors felt that the accuracy achieved at the canopy level demonstrates the feasibility of using hyperspectral sensors to cheaply and rapidly map tea quality properties at the landscape scale for better management of tea plantations.
Soil organic carbon
Agricultural soils have the potential to act as carbon sinks, wherein atmospheric carbon dioxide is transferred into the soil via crop residues, providing an off-set from fossil-fuel combustion. In addition, soil organic carbon (SOC) levels influence soil health and productivity. Thus, knowledge of the spatial distribution of SOC levels is needed to guide improvement to agricultural practices. As part of their Rapid Carbon Assessment project, the Soil Science Division of the Natural Resource Conservation Service developed a NIRS-based method to map baseline SOC levels across the U.S. As part of this effort, calibrations were carried out both on dried ground and fresh (wet) samples. Results were similar to the tea quality study: While the fresh calibrations were of lower accuracy, they were sufficient for rapid mapping of large areas.
In a study carried out by a research group at The University of Sydney in Australia, reflectance spectra collected in the field using an ASD field-portable spectroradiometer, as well as those extracted from Hyperion hyperspectral imagery, demonstrated the feasibility of mapping SOC at the landscape scale. Both the field reflectance spectra and Hyperion hyperspectral imagery were collected at a time of year when agricultural soils were reasonably dry and bare of vegetation since conditions of the soil surface, vegetation cover and high soil moisture can all mask the underlying SOC reflectance signature. Since the SOC calibrations were based on reflectance spectra, the team performed a radiance-to-reflectance conversion of the Hyperion hyperspectral data prior to the generation of SOC maps. While the SOC map generated by the Hyperion hyperspectral imagery was less accurate than the point measurements performed with the field-portable spectrometer system, the ability to generate these maps facilitates the implementation of digital soil mapping at a regional scale.

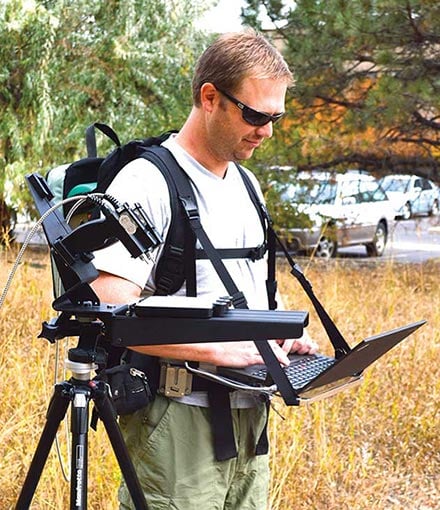
Ground-truth signatures collected in the field and indexed in spectral libraries are critical for many methods of analysis. Courtesy of ASD.
The combination of field-collected reflectance spectra, NIRS chemometric calibrations and hyperspectral imagery provides the means to derive quantitative information about a wide range of materials. The applications range far beyond the two examples given in this article (tea quality and soil organic carbon); with the advent of globally available hyperspectral imagery, it will be possible to generate quantitative maps of any natural or man-made material with diagnostic features in the solar-reflected wavelength range. This approach requires the field collection of representative reflectance spectra of surfaces or materials with known reference values for the property or properties of interest. While time consuming, the building of an adequately sized NIRS calibration database that encompasses the variability encountered within the image scene and with accurate reference values is critical to the accuracy of the resultant calibration.
Meet the author
Brian Curtiss is one of the founders of ASD Inc. and currently serves as its chief technical officer. He has over 35 years’ experience in the fields of geology, spectroscopy and optical remote sensing. He holds a bachelor’s degree from Washington University in St. Louis and a master’s and Ph.D. in geochemistry from the University of Washington; email: [email protected].
/Buyers_Guide/ASD_Inc/c833
Published: September 2017
Glossary
- remote sensing
- Remote sensing is a method of data collection and observation where information about objects, areas, or phenomena on Earth's surface is gathered from a distance, typically using sensors onboard satellites, aircraft, drones, or other platforms. This technique enables the monitoring and analysis of Earth's surface and atmosphere without direct physical contact.
Remote sensing systems capture electromagnetic radiation (such as visible light, infrared, microwave, or radio waves) reflected or...
- hyperspectral imaging
- Hyperspectral imaging is an advanced imaging technique that captures and processes information from across the electromagnetic spectrum. Unlike traditional imaging systems that record only a few spectral bands (such as red, green, and blue in visible light), hyperspectral imaging collects data in numerous contiguous bands, covering a wide range of wavelengths. This extended spectral coverage enables detailed analysis and characterization of materials based on their spectral signatures.
Key...
- spectroradiometer
- A spectroradiometer is a device used to measure the intensity of light at different wavelengths across the electromagnetic spectrum. It provides a detailed spectral distribution of light, breaking down the electromagnetic radiation into its constituent wavelengths. This device is particularly useful in applications where precise information about the spectral characteristics of light is essential, such as in the fields of optics, remote sensing, astronomy, colorimetry, and environmental...
spectroscopyImagingremote sensingNIRSChemometricshyperspectral imagingground truthingSensors & DetectorsspectroradiometeragricultureBrian CurtissASDFeatures