An understanding of 2D and 3D metrology can help designers and manufacturers make the right choices when characterizing aspherical lenses.
JUSTIN TRACY, LACROIX PRECISION OPTICS
As aspheres become more prevalent in optical systems and more companies design systems that include them, it is crucial that both designers and manufacturers understand what is needed and what the limitations are in regard to metrology. The most critical aspect in the designer/manufacturer relationship is communication, as it ensures that the supplied asphere is precisely what the customer needs, without the additional costs of unnecessary measurements or tolerances. The following is an essential practical guide to measuring aspheres, including a couple of real-world manufacturing examples.
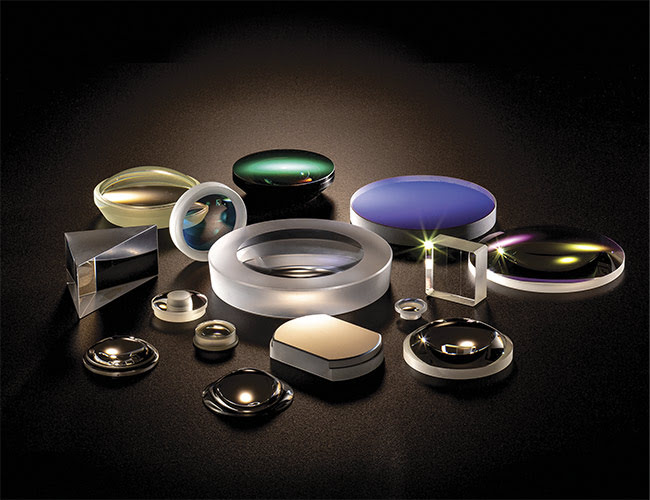
Aspheric surfaces can be measured either two-dimensionally (for form) or three-dimensionally (for irregularity). There are advantages and disadvantages to each, and understanding both can help determine which method is best for performance and budgetary needs.
2D measurements
The most common method of measuring a general aspheric shape is to use a contact profilometer to perform a trace across the vertex of the part (Figure 1). The deviation of the stylus as it travels across the part is compared with the asphere’s conceptual design (theoretical shape), and the difference between the two is displayed as the error. This process is typically filtered to remove measurement noise and gives a 2D view of the asphere.
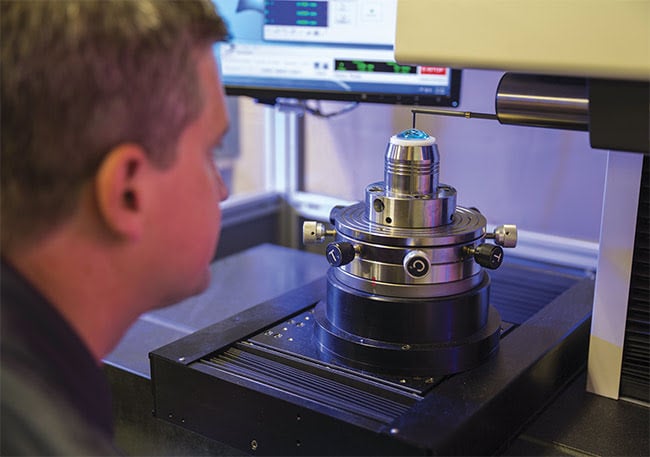
Figure 1. Using a contact profilometer to measure an aspherical lens. Courtesy of LaCroix Precision Optics.
Profilometry provides a quick and accurate reading of the lens and can be used to measure aspheres that have significant departures from the best-fit sphere, gull-wing shapes, and inflection points. Limitations of 2D profilometry include the sag range of the stylus, the danger of scratching the lens when processing soft materials, the reduced precision achieved when measuring parts with high included angles, and error measurements limited to the stylus’ path (Figure 2). The latter limitation creates the very real possibility that the measurement data will show that a lens is within specification even though there may be significant errors not along the measurement path, errors that will make the lens fail to conform to specifications.
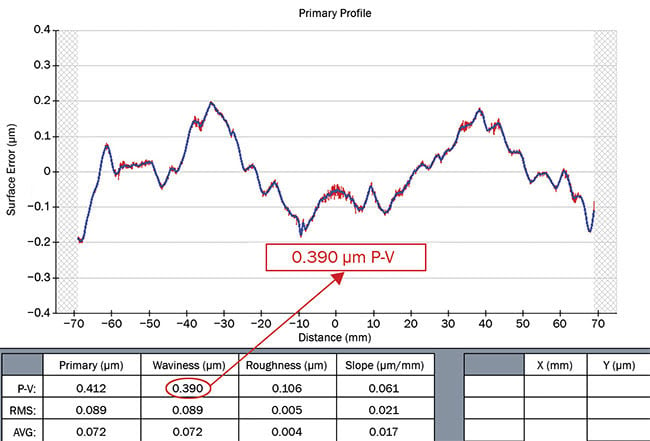
Figure 2. Single trace of an asphere, measured using a 2D profilometer. Courtesy of LaCroix Precision Optics.
Because of its speed and accuracy, the profilometer is invaluable for providing feedback into the grinding process to correct rotationally symmetric errors. Using 2D to measure and correct during the polishing process, however, has greater limitations. Its single slice measurement data, while useful for correcting symmetrical errors, cannot fully characterize asymmetrical errors even if known asymmetry is present.
Since the asymmetry cannot be properly characterized with a single 2D slice, a common option is to perform a second trace with the part rotated 90°. If there is no asymmetry, these two traces will look the same. If asymmetry is present, the data is not sufficient to provide feedback into a polishing tool for corrections because the lack of detail between the traces and the actual magnitude of the error is indeterminate. It is also possible to miss significant errors between 0° and 90°, even if both traces are identical.
Additional slices can be added to characterize the surface better, and some software will allow these slices to be stitched together for a rudimentary 3D map. These additional slices will add more measurement time and cost to the optic, and any map generated from them is limited in resolution, especially toward the edges of the part. There are also subaperture polishing tool signatures that this technique will not characterize well, such as spokes. While extra slices give the manufacturer and customer additional data, these slices still fail to fully characterize the lens and may even indicate a part is in specification when significant errors remain.
3D measurements
To overcome the above limitations of the single line trace, various 3D measuring technologies have been developed and are commercially available. These include null lenses, computer-generated holograms, stitching interferometers, chromatic confocal sensors, and contact profilometers that can perform a raster or spiral scan of the part. Each has its strengths and limitations. Most measurements are noncontact, so there is no danger of the tool damaging the surface (Figure 3). One aspect that all 3D measurements have in common is their ability to provide significantly more information about the quality of an aspheric surface compared with single or even multiple
2D traces.
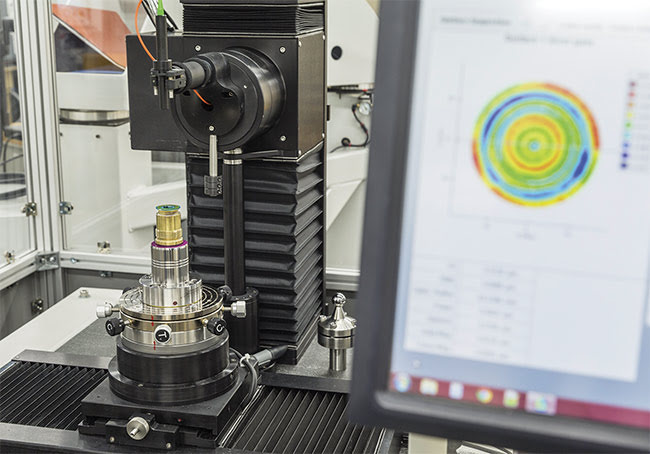
Figure 3. A noncontact profilometer used for 3D measurements. Courtesy of LaCroix Precision Optics.
At the most basic level, the 3D measurement provides a full map of the surface, just as one would see when measuring a spherical part with a phase-shifting interferometer. Not only does it allow one to characterize — and perhaps correct with further processing any symmetric and asymmetric features — but it also allows a more in-depth analysis of the surface. The 3D map can be manipulated and filtered to include Zernike analysis, residuals after Zernike terms are removed, slopes, specific frequency content that may be detrimental to the optical system, and various ISO 10110-5 specifications (e.g., RMSi or RMSa).
To illustrate one of the advantages of a 3D measurement over the 2D trace, we will revisit the asphere measured in Figure 2. The same part was remeasured using the UltraSurf 4X and then corrected using subaperture polishing techniques (Figure 4). Clearly, the 2D trace did not show the extent of the error on the part, which went from a generally symmetric 0.39 µm peak-to-valley (P-V) in 2D to 1.46 µm dominated by astigmatism in 3D. If this part were measured at several angles on the 2D trace, the asymmetry would only be noticeable by a small variation in the optimized vertex radius of the traces. With a full 3D map, this part was corrected to 0.29 µm P-V.
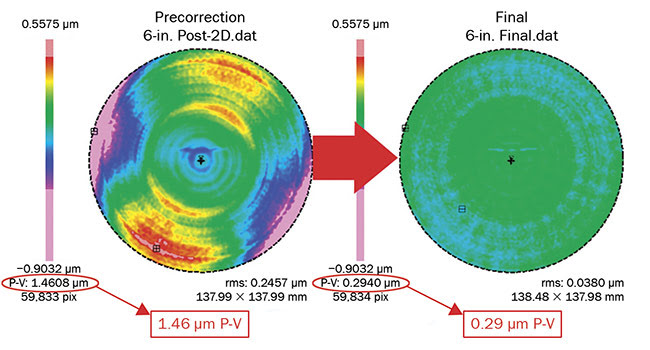
Figure 4. A 6-in. asphere before and after 3D correction. Courtesy of LaCroix Precision Optics.
For aspheres where the midspatial frequency (MSF) content is essential to system performance, the 3D data can be used to better characterize these features when compared with a 2D trace. Two common methods of controlling the MSF on a lens are to specify an rms (root mean square) value after 36 Zernike terms are removed and to analyze the local slope of the errors. The Zernike method is only valid with a 3D measurement, and the slope method provides minimal information when only a 2D slice of data is analyzed (e.g., a ring will be characterized but a spoke will not).
Figure 5 illustrates the ability of a 3D measurement to characterize these MSF errors. The part in the top row was processed first. The P-V figure of the part was well within specifications, but an analysis of the Zernike residuals and local slope showed that the part had a very mottled appearance. As a result, a process change was performed and it was possible to significantly reduce MSF errors in the subsequent parts. If the part were measured with a 2D profilometer, it is unlikely this issue would have been noticed during manufacturing.
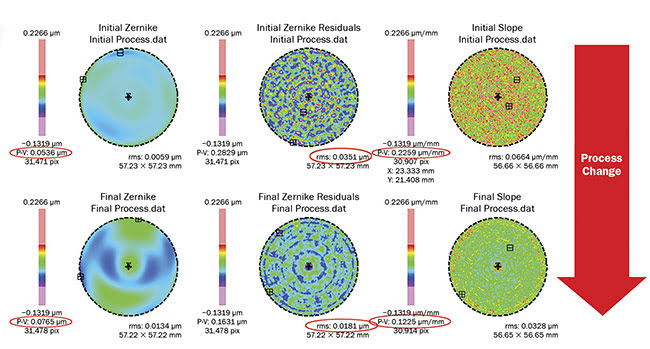
Figure 5. A 36-term Zernike map, Zernike residuals, and slope map of the initial process (top row) and final process (bottom row). Courtesy of LaCroix Precision Optics.
A part measured in 3D will show the magnitude of the irregularity to be higher compared with a 2D measurement because of an increased number of data points and potential asymmetry on the part. In addition, with the extra time required to measure and polish a part to a given specification, the 3D-measured part will cost more but will perform better than the 2D-measured part.
When specifying aspheric surfaces, one should keep in mind the parameters that are most important to the performance of the system and ensure specifications are in place to control them. Do not add unnecessary slope or spatial band tolerances to the surface, and instead ensure that the manufacturer is capable of measuring what is important. The 3D measurement generally allows a greater variety of parameters to be characterized, if needed. Be sure to communicate analysis windows, filters, and data density with the specifications, as these may also affect how the part is measured.
Meet the author
Justin Tracy is advanced process supervisor at LaCroix Precision Optics. He has over 15 years of experience in manufacturing precision optics, specializing in subaperture processes.