A hand-held hyperspectral camera based on a Fabry-Pérot interferometer shows promise in monitoring vascular disease, tumors, neuropathy, and dermatological conditions.
Alexandre Fong and George Shu, HinaLea Imaging
The measurement of blood oxygen levels, or oxygen saturation (SpO2), is a critical medical diagnostic parameter. Levels below 95% are considered abnormal and called hypoxemia, or blood oxygen deficiency. This condition is associated with patients suffering from many conditions, including asthma, heart disease, chronic obstructive pulmonary disease, anemia, and an obstruction of an artery in the lung due to a blood clot. SpO2 is monitored in patients with these conditions, as well as in patients presenting with life-threatening cyanosis, a bluish-purple discoloration of body tissue.
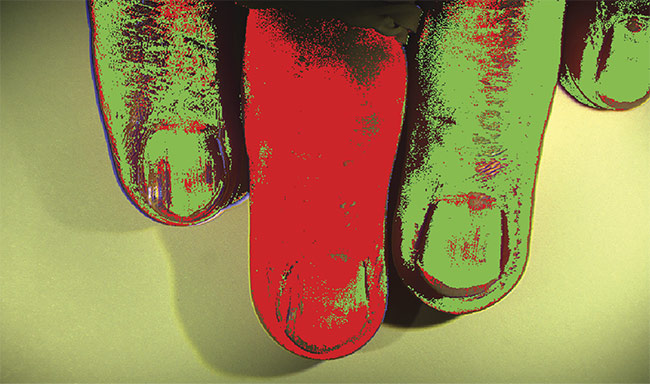
A classified image of the co-author’s fingers, with a tourniquet applied to the middle finger. Courtesy of HinaLea Imaging.
However, the monitoring of SpO2 levels is also relevant for patients undergoing brain and other surgical procedures, such as flap surgery, where intact tissue is transplanted with a working blood supply. Such monitoring also aids patients being treated for peripheral vascular disease, tumors, systemic rheumatic disease, neuropathy, sepsis, and wounds from conditions such as diabetic foot ulcer1,2. A pulse oximeter — an optical device that measures the ratios of two critical bandpasses of light through an appendage, often a fingertip — is the conventional method for measuring SpO2. This device provides an approximate average reading of blood oxygenation for the entire body. It does not, however, provide information about local distribution of oxygen within the body.
Hyperspectral imaging cameras generate hypercubes or datacubes, whereby the spectrum at each pixel in the image is collected. Subtle reflected color differences that are not observable by the human eye or even by color (RGB) cameras are immediately identifiable by comparing spectra between pixels. A variety of spectral imaging technologies exist for this purpose.
The most common type of hyperspectral imager is the pushbroom system, whereby a line on the object plane generates a 2D pattern on an array sensor. Pushbroom grating systems, initially developed by NASA, were the earliest forms of hyperspectral cameras, and they were mounted on satellites and airborne platforms for research purposes. When using pushbroom imaging systems, collecting a complete datacube (2D spatial × 1D spectral) requires mechanical scanning. While the dispersing elements can be made small, and each spectrum can be collected in as little as 1 ms, the mechanical motion makes these systems somewhat bulky and prone to misalignment. Furthermore, increased spatial resolution comes at the expense of longer collection times3,4.
Band sequential, or front-staring, imagers do not require mechanical scanning. Incorporated into this technology is a tunable filter that can sequentially select spectral bands. The filter is placed in front of the sensor and the hypercube is generated by collecting complete images at each spectral bandpass. The acquisition time does not depend on the number of pixels, but rather on the number of spectral bands being acquired. These imagers are especially attractive for applications that require high spatial and spectral resolutions with tunable spectral ranges in a small form factor, such as medical applications in labs and clinics.
Often discussed together with hyperspectral imaging are multispectral systems, many of which are based on patterned filter arrays. But multispectral imagers are not necessarily interchangeable with hyperspectral imagers. Multispectral systems are an extension of color cameras in which the Bayer or RGB filters that are overlaid on the color camera’s image sensor are replaced with an array of 16 or more color filters. While no user alignment is needed and the imagers can be miniaturized, the spectral resolution of multispectral imagers is limited and comes at the expense of spatial resolution, making this technology inadequate for many sample analysis applications.
An answer to this dilemma can be found in Fabry-Pérot interferometers, which consist of two parallel reflecting surfaces, or mirrors. By controlling the reflectivity of the mirrors and their spacing, high-finesse spectral filtering can be achieved (Figure 1). A recently developed battery-operated, hand-held staring hyperspectral camera based on a Fabry-Pérot interferometer captures multimegapixel images in 300 spectral bands in seconds. Embedded hardware can enable real-time processing, so that the user does not need to handle the large data sets typically generated by hyperspectral systems. The technology helps to identify features of interest in both the spectral and spatial domains and classifies the features in the image5.
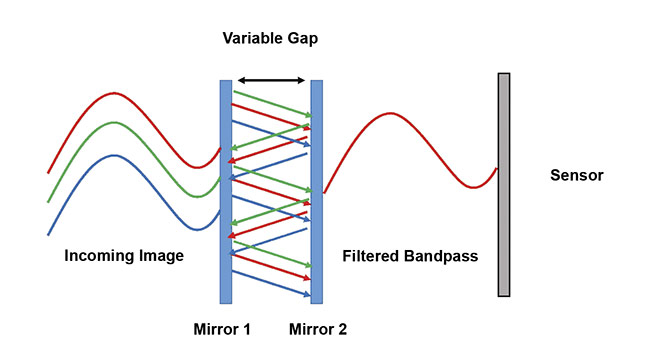
Figure 1. The operating principle of the Fabry-Pérot filter used in the hyperspectral camera of the authors’ experimental setup. Courtesy of HinaLea Imaging.
The technology can easily be configured into form factors and configurations suitable for laboratory benchtop investigations, production line testing, and microscopy. Such an implementation has not been possible in a typical laboratory setting using other similar band sequential techniques — for example, acousto-optic and liquid crystal tunable filters — due to cost, speed, and reproducibility issues, as well as environmental and power restrictions.
Segmentation algorithms
Once captured, hyperspectral imaging datacubes are not directly intuitively interpretable. The datacubes must be mathematically processed in order to identify spectra of interest according to their pixels. The advent of widely accessible machine learning methods and their inherent algorithms has brought a new and powerful set of tools to this endeavor.
These algorithms represent the large matrices of spectral data as vectors in an n-dimensional space. For example, principal component analysis (PCA) is used to simplify complexity in high-dimensional data while retaining trends and patterns by transforming data into a space with fewer dimensions in which to summarize features. PCA geometrically projects data onto lower dimensions, called principal components, with the goal of finding the best summary of the data. This is accomplished by limiting the number of components and minimizing the total distance between the data and the components’ projections.
K-means is an iterative clustering algorithm used to classify data into a specified number of groups by beginning with an initial set of randomly determined cluster centers. Each pixel in an image is then assigned to the nearest cluster center by distance, and each cluster center is then recomputed as the centroid of all pixels assigned to the cluster. This process repeats until a desired threshold establishing statistical likelihood is achieved. Spectral angle mapping compares a given spectra to a known spectrum, treating both as vectors and calculating the spectral angle between them, and groups them with respect to a threshold based on the angle. Spectral angle mapping is widely used due to its insensitivity to brightness differences6,7.
A composite image can then be generated from the grouped data that is processed through the use of the algorithms, providing an easily interpreted indication of the early presence of chronic and serious conditions, thus allowing for prompt treatment by a clinician. A subsequent threshold based on statistical likelihood can be applied in order to provide a binary answer or response to the condition. This response can include false-color image presentation or go/no-go flags, or warnings at the data interpretation stage, thus automating the detection of pathogens and enabling fast identification and intuitive visualizations of particular illnesses.
Oxy- and deoxyhemoglobin
To demonstrate the potential for measuring blood oxygenation using hyperspectral imaging techniques, a simple experiment was performed using the co-author’s hand. A rubber band tourniquet was applied to the middle finger and a milking procedure was performed to isolate the blood in the appendage8.
The experimental setup was composed of a HinaLea Imaging Model 4200 hyperspectral imaging camera (featuring a 45-mm f/6.7 with a 19° FOV and a
250-mm to 1-m working distance) and a 50-W MR16 halogen lamp with a UV glass cover for illumination. See Figure 2 for the configuration of the setup with respect to the test subject. Once focus, gain, and exposure were set, white reference and dark noise calibrations were performed, and the camera captured a datacube of the middle finger when the tourniquet was on, and when it was off.
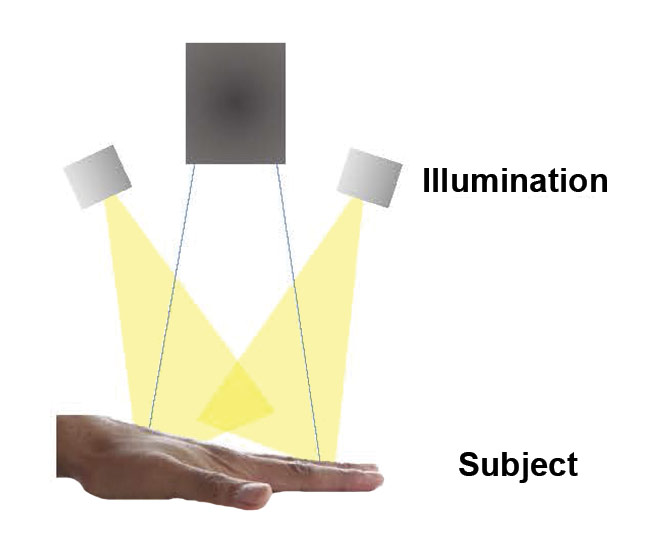
Figure 2. A schematic of the optical path for image capture by the Fabry-Pérot variable etalon hyperspectral imager. Courtesy of HinaLea Imaging.
By sampling a region of pixel spectra on the finger when the tourniquet was on (Figure 3) and when it was off, the characteristic spectral differences (from 500 to 600 nm) between the spectra of oxygenated and deoxygenated (oxy- and deoxy-) hemoglobin were observed9. Five sample locations were averaged from the finger when the tourniquet was on and five from when it was off, and a five-point smoothing was applied to generate a comparison.
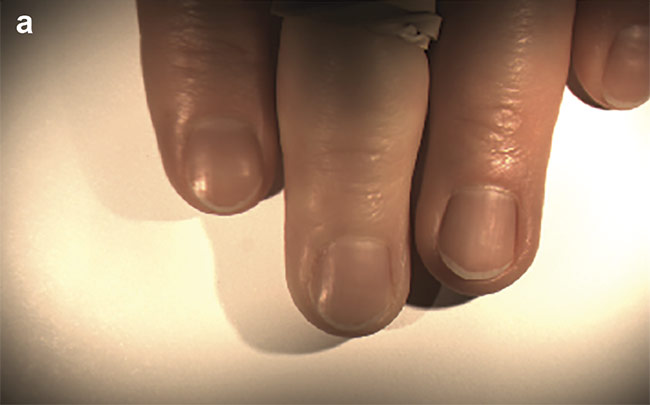
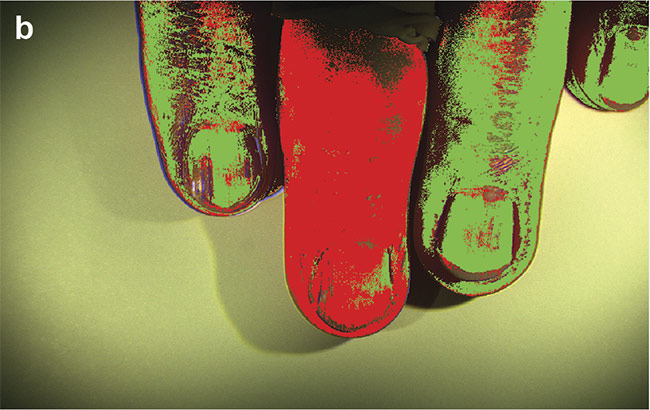
Figure 3. The co-author’s fingers, with a tourniquet applied to the middle finger (a). A classified version of the same image (b). Courtesy of HinaLea Imaging.
Utilizing open-source tools, spectral angle mapper algorithms were adapted to classify regions of the image with respect to spectral libraries that referenced oxy- and deoxyhemoglobin. As previously discussed, by representing the spectra as vectors in n-dimensional space, spectral angle mapping calculates a spectral angle between the library spectra and the mean spectra of each cell. It was determined that a spectral angle <0.10 was an appropriate threshold for differentiating between background, noise, and other objects in the image. Pixels were marked within this spectral angle using a red outline. Pixels outside of this threshold were marked using a green outline (Figure 4).
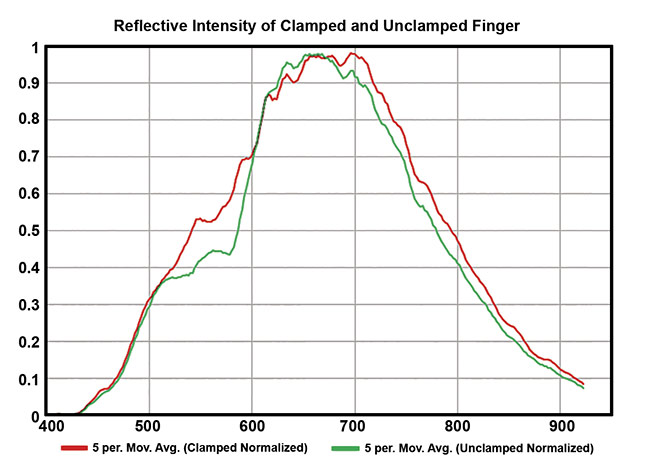
Figure 4. Five sample locations were averaged from the finger when the tourniquet was on and five from when it was off, and a five-point smoothing was applied to generate a comparison. Courtesy of HinaLea Imaging.
The same approach can be extended to noninvasively monitor, detect, and identify other conditions. Dermatological disorders are good candidates for diagnostics based on hyperspectral imaging. Figure 5 depicts a setup for examining moles on a subject’s back. In this setup, two high-intensity composite LED illumination panels (with R, G, B, Y, and W elements to generate a broad and relatively flat spectrum) were used, with an output of approximately 20,000 lux.
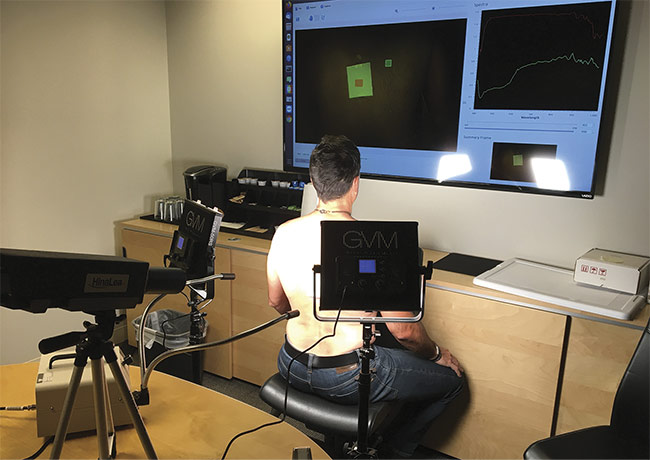
Figure 5. A hyperspectral imaging setup is used to examine moles on a subject’s back. Courtesy of HinaLea Imaging.
Figure 6 shows the difference between the spectral profiles (400 to 600 nm) of normal skin and moles on a subject’s back, and Figure 7 shows an image that was classified based on the spectral library defined by the mole data. This setup and method could potentially be used to identify dermatitis and melanoma, as well as to monitor wounds and diabetic ulceration, or other skin conditions that involve subtle discoloration.
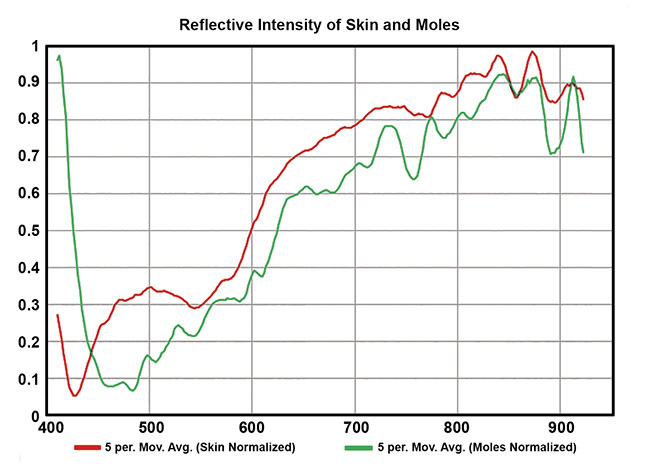
Figure 6. Spectra from normal skin and moles. Courtesy of HinaLea Imaging.
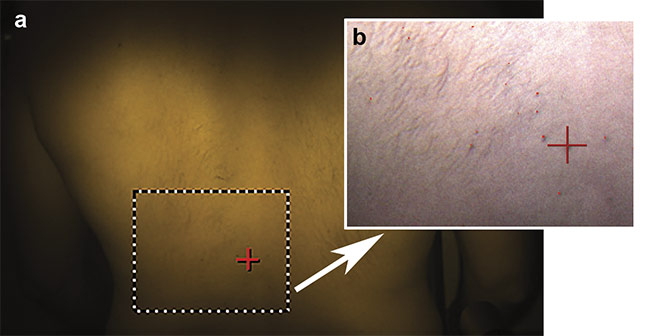
Figure 7. An image of a subject’s back showing classification (a). The magnified region of interest, with moles visualized as false-colored red (b). Courtesy of HinaLea Imaging.
These demonstrations show that hyperspectral imaging technology has the potential to be used for measuring and monitoring blood oxygen, as well as in a variety of dermatological diagnostics. In addition, the unique ability of the modality to dynamically change spectral range and bandpass capability means that the same instrument can be quickly configured for a wide variety of specific tests or uses within a software interface designed for a nonspecialist user.
Depending on the application, either the spectral range or the number of bandpasses — or both — may be reduced, making it possible to capture and classify data in real or near real time. This capability has been successfully applied to other applications, ranging from food processing to inspection of nuclear reactors. The latter also involved the expansion of the spectral response range of the instrument into the shortwave infrared (SWIR), which extends from 1000 to 1700 nm. This added capability may make it possible for hyperspectral imaging to identify an even wider range of dermatological conditions at earlier stages, such as contact dermatitis. Work is also underway to extend this capability even farther into the IR as well as into the UV.
Significant progress has recently been made in reducing the size of the instrument, which is currently compact enough to fit in the palm of a hand. A future, more specialized version of this technology, with embedded processing and reporting capabilities, could be made even more compact — on the scale of a smartphone.
Finally, the cost advantages of the technology relative to other hyperspectral imaging solutions would vastly improve its accessibility. The potential to further lower costs provides the basis for broader improvements in health outcomes, particularly for patients in remote and underserved communities. Such a tool would be of tremendous benefit in clinical and point-of-care environments.
A partnership is currently underway between the authors and researchers at several institutions, including Vanderbilt University, to tailor the technology to meet such needs. The group is using the instrument to explore active inflammation (erythema) in common dermatological conditions that can affect the whole body, such as atopic dermatitis, psoriasis, post-transplant rashes, and chronic graft-versus-host disease, which can be a side effect of stem cell transplants.
Meet the authors
Alexandre Fong is vice president of engineering and director of hyperspectral imaging at HinaLea Imaging, a business unit of TruTag Technologies. He has a bachelor’s degree in applied computational mathematics and physics, and a master’s degree in experimental and applied physics, both from York University in Toronto. Fong also has an MBA from the University of Florida, and he is a chartered engineer (CEng.); email: [email protected].
George Shu is principal systems engineer at HinaLea Imaging, a business unit of TruTag Technologies. He has a doctorate in mechanical engineering and physics from Louisiana State University; email: [email protected].
References
1. N. Chiang et al. (2017). Evaluation of hy-perspectral imaging technology in patients with peripheral vascular disease. J Vasc Surg, Vol. 66, No. 4, pp. 1192-1201,
www.doi.org/10.1016/j.jvs.2017.02.047.
2. A. Nouvong et al. (2009). Evaluation of diabetic foot ulcer healing with hyperspectral imaging of oxyhemoglobin and deoxyhemoglobin. Diabetes Care, Vol. 32, No. 11, pp. 2056-2061, www.doi.org/10.2337/dc08-2246.
3. C.H. Bock et al. (2010). Plant disease severity estimated visually, by digital photography and image analysis, and by hyperspectral imaging. CRC Crit Rev Plant Sci, Vol. 29, No. 2, pp. 59-107, www.doi.org/10.1080/07352681003617285.
4. G. Lu and B. Fei (2014). Medical hyperspectral imaging: a review. J Biomed Opt, Vol. 19, No. 1, p. 010901, www.doi.org/10.1117/1.jbo.19.1.010901.
5. H. Finkelstein and A. Fong (2018). Development of a hand-held high-resolution hyperspectral imaging camera. Presented by HinaLea.
6. B. Hass (2021). Tutorial: Unsupervised spectral classification in Python: KMeans & PCA, www.neonscience.org/classification-kmeans-pca-python.
7. University of Texas Center for Space Research. Analysis of hyperspectral imagery, www.csr.utexas.edu/projects/rs/hrs/analysis.html.
8. C.L. Thomas (1997). Taber’s Cyclopedic Medical Dictionary, 18th ed. F.A. Davis.
9. F.E. Robles et al. (2010). Assessing hemoglobin concentration using spectroscopic optical coherence tomography for feasibility of tissue diagnostics. Biomed Opt Express, Vol. 1, No. 1, p. 310, www.doi.org/10.1364/boe.1.000310.