Long used for displays, digital micromirror devices are enabling more cost-effective near-IR spectrometers for use in process analytical technology and other applications.
Since its emergence in the 1990s,
digital micromirror device (DMD) technology has been used extensively in display applications for conference rooms and cinemas. The technology has also supported dense wavelength division multiplexing (DWDM) wavelength switching in telecom transport networks. The use of DMD technology for spectroscopy applications, however, is fairly recent and requires advanced optical designs that must take into consideration multiple diffraction orders of the mirror array itself.
Initially developed for color projectors operating in the visible range, DMDs are optical microelectromechanical systems (MEMS) comprising an array of highly
reflective aluminum micromirrors. Applied to spectroscopy, however, the most promising applications for DMDs lie in the near-IR (NIR) range. While low-cost CMOS detectors based on silicon put DMD-based spectrometers in the visible range at a cost disadvantage, spectrometers targeting the NIR require linear array detectors leveraging more specialized and costly materials such as indium gallium arsenide. DMD technology can replace these linear array detectors with single-area detectors and thereby significantly reduce overall cost.
A DMD can be used to simply scan through a wavelength range and thus provide the spectral intensity at each wavelength in the range. DMD technology also offers more advanced scan options. For example, the Hadamard scan function that is often used with DMD spectrometers can improve signal-to-noise ratio without increasing the scan time1.
One of the most important applications of NIR spectroscopy is process analytical technology (PAT), which was developed by the FDA in 2004 as a mechanism for designing, analyzing, and controlling food and pharmaceutical manufacturing processes. Predictably, the food industry has come to offer many examples of how a DMD spectrometer can support either reflection or transmission geometries for typical PAT applications.
DMD spectrometers
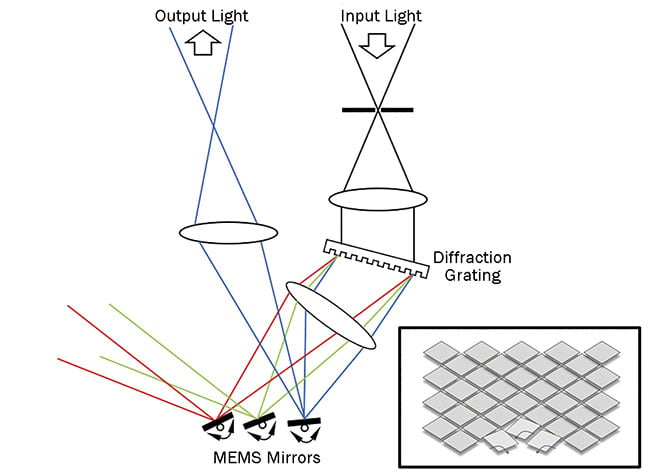
A DMD is a 2D array of tiny mirrors manufactured as MEMS structures in silicon, as shown in Figure 1. The micromirrors can occupy three distinct positions: neutral (flat), right tilt, or left tilt. The angular tilt is very reproducible and stable against vibration.
Figure 1 shows how a simple DMD array of only three mirrors can create a spectrometer. The input light enters a slit and is collimated before a diffraction grating separates the wavelengths in the spectrum and a collimation optic focuses the different wavelengths onto the DMD array. By controlling the tilt of individual mirrors,
it is possible to select a wavelength and send it to a photodetector. By successively turning the mirrors from the OFF state to the ON state one by one, it is possible to scan through the entire wavelength range.

Figure 1. The key elements of a spectrometer that leverages digital micromirror device (DMD) technology. DMDs comprise 2D arrays of tiny mirrors manufactured as MEMS structures in silicon. The mirrors are arranged in a 2D array and can be tilted right or left (inset). Courtesy of Thomas P. Rasmussen/Ibsen Photonics.
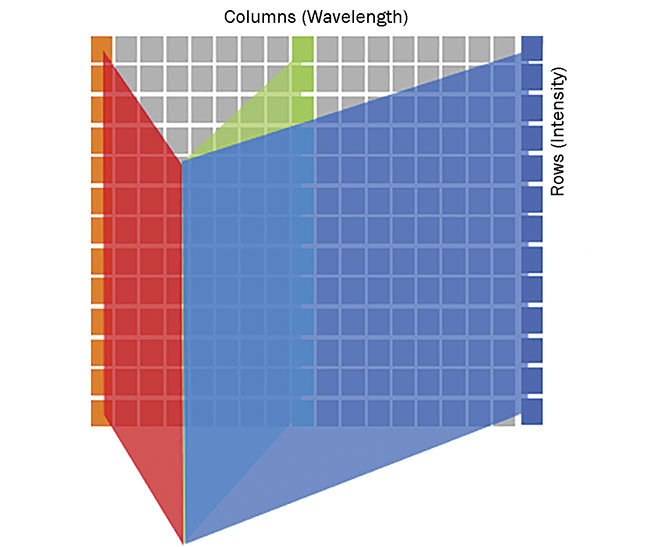
A simplified example is illustrated in Figure 1. A more realistic design would use a 2D mirror array, as shown in the inset. Each column of mirrors is illuminated with a specific wavelength, as illustrated in Figure 2.

Figure 2. Wavelength illumination on the columns of the DMD array. Each column of mirrors in a DMD-based spectrometer is illuminated with a specific wavelength. This makes it possible to scan through the spectrum by turning a complete column of mirrors one by one to the ON state. Courtesy of Thomas P. Rasmussen/Ibsen Photonics.
In this manner, it is possible to scan through the spectrum by turning a complete column of mirrors, one by one, to the ON state. However, DMD technology enables even more advanced scan options beyond the simple column scan. It is possible to perform an equalization of the combined reference lamp spectrum and detector response by turning only some of the mirrors in a column to the ON state. For wavelengths with strong intensity, only a few mirrors are turned ON; for wavelengths with weaker signals, more mirrors in the corresponding column are turned ON.
Hadamard scanning defined
Hadamard scanning is a common
advanced option for DMD-based spectrometers that enables a substantial improvement of signal-to-noise ratio over the column scan method. In a Hadamard scan, multiple columns of the DMD are turned ON at the same time, in patterns that follow a specific design. Figure 3 illustrates one possible series of patterns occurring across seven columns.

Figure 3. The Hadamard scan sequence for N = 7.
In this type of scan, multiple columns of the DMD
are turned ON at the same time in patterns that
follow a specific design. This scan illustrates one
possible series of patterns occurring across seven
columns. Courtesy of Thomas P. Rasmussen/Ibsen Photonics.
In the general case of N columns, if the intensity at column i (wavelength λi) is denoted by Ii, the intensity measured at the photodetector (Rj) will be the sum of the intensities from the columns that have been turned ON for each pattern. After a complete scan over the N patterns, we end up with a number of equations:

The values hji are all either equal to 0 or 1, depending on whether the mirror in row j and column i has been turned ON
(hji = 1) or OFF (hji = 0).
If the equations are written in a matrix equation (shown below), the matrix H
is given by the patterns we have chosen, and the vector R contains the measured
intensities at the detector.

The vector I in the matrix equation contains the unknown spectral intensities, which can be found by solving the matrix equation with standard linear algebraic methods.
Hadamard scanning is a common advanced option for DMD-based spectrometers that enables a substantial improvement of signal-to-noise ratio over the column scan method.
For a Hadamard scan, the matrix H must be a Hadamard matrix that satisfies
two criteria: The matrix elements must be either 0 or 1; and,
for every two neighboring columns and rows in the matrix, half
of the elements must be the same and half must be different.
The benefit of the Hadamard scan method is that the signal-to-noise ratio is improved by a factor of √N/2, where N is the number of Hadamard patterns. For a DMD array with 854 columns, for instance, the signal-to-noise ratio can be improved by a factor of 14 compared to a simple column scan method.
Four configurations
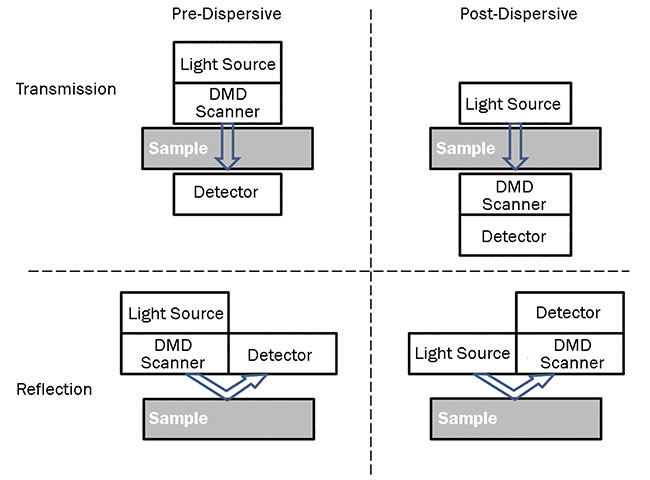
DMD-based spectrometers enable four different configurations, where the spectrum is measured in either a reflection or transmission geometry, and where sample illumination is either pre- or post-dispersive. See Figure 4 for an overview of the configurations.

Figure 4. DMD-based spectrometers enable four different configurations, in which the spectrum
is measured in either a reflection or transmission geometry, and sample illumination is either pre- or
post-dispersive. Courtesy of Thomas P. Rasmussen/Ibsen Photonics.
A transmission geometry applies when the sample material
is in a thin and transparent container or tube. Light enters the sample from one side and the detector is placed on the opposite side.
If the sample is too thick, the NIR light will be absorbed or scattered before it reaches the detector and no spectrum will
be detected. A reflection geometry is more suited to such situations, because the light source and detector are placed on the same side of the sample and the spectrum is measured from reflected light. One potential limitation of a reflection geometry is that
it may only measure close to the surface of the sample.
DMD technology allows pre- and post-dispersive configurations for both transmission and reflection geometries. In a
pre-dispersive configuration, the DMD scanning device is positioned so that the sample sees only one wavelength (or one
Hadamard pattern) at a time. This method can be beneficial
in cases where exposure to the full spectrum of the light source
may heat the sample, potentially damaging the sample and/or distorting the measurements. Conversely, in a post-dispersive configuration, the DMD scanning device is positioned after the sample.
Food industry applications
The FDA created guidelines on the application of PAT for monitoring and controlling critical process parameters in pharmaceutical and food manufacture in large part to ensure consistent quality of the end products, with minimal overprocessing and waste2. Monitoring should preferably be done in-line to enable real-time feedback loops. For example, if a critical process parameter is the water content of cookie dough, the manufacturer should monitor water content during mixing. If the content rises above a certain threshold, the amount of water
added in the process should be reduced.
One of the technologies that the FDA recommends for in-line monitoring is PAT based on NIR spectroscopy from 0.8 to
2.5 µm. The IR range from 3 to 10 µm
is actually preferable since most organic molecular bonds found in pharmaceutical and food applications exhibit distinct and strong absorption peaks in that window. However, instrumentation designed for that range is
generally very sensitive to vibration and often requires direct contact with the sample material. So such instruments are not suitable as in-line sensors in a manufacturing environment.
In contrast, NIR instruments can be built without moving parts and then applied in a stand-off configuration, which makes them more stable against vibration and better suited for PAT applications. One drawback of NIR spectroscopy over IR spectroscopy is that NIR peaks are generally quite broad and overlapping, so advanced multivariate mathematical methods (chemometrics) must be used to extract quantitative concentration data from the measured spectra.
Applying NIR sensors in a manufacturing setting imposes different performance requirements than those for instruments used in a laboratory. First, industrial-grade instruments must often operate close to 24 hours a day, seven days a week. This means that they should require little or no daily recalibration.
Second, all NIR sensors should provide the same results when presented with the same sample. This is referred to as transferability and ensures that process control is independent of the specific instrument being used. This may sound obvious,
but it is not a trivial task to manufacture NIR sensors with low unit-to-unit variation.
Third, NIR sensors need to be environmentally rugged since they will be used
on the factory floor, where they are exposed to dust, vibration, and variations in temperature.
Performance
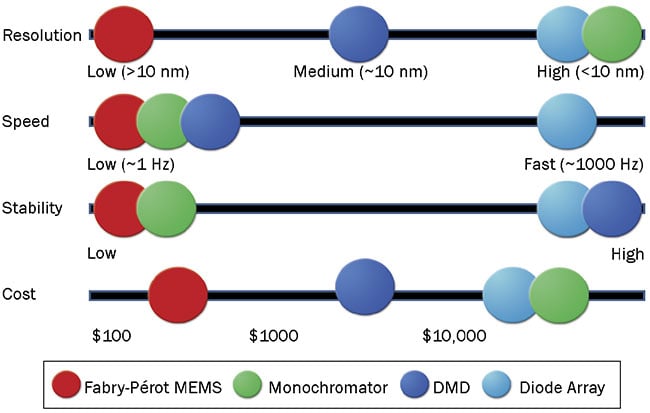
Four common types of NIR sensor technologies are available: scanning grating monochromators, fixed grating diode array spectrometers, scanning Fabry-Pérot MEMS sensors, and DMD scanning spectrometers. Evaluation of these technologies is made possible by comparing their performance in terms of resolution, scan speed, robustness, and cost. Figure 5 summarizes the overall performance of the four technologies.

Figure 5. A comparison of NIR-spectrometer technologies in terms of resolution, scan speed, stability, and cost. The four common types of NIR sensor technologies include scanning grating monochromators, fixed grating diode array spectrometers, scanning Fabry-Pérot MEMS sensors, and DMD scanning spectrometers. Each has its merits and drawbacks. Courtesy of Thomas P. Rasmussen/Ibsen Photonics.
Resolution — In general, the optical resolution of spectrometers for NIR spectroscopy does not have to be extremely high since the spectra are smooth, with no sharp peaks. Of the four technologies, diode array spectrometers and scanning grating monochromators are the most capable of providing the best optical resolution — typically better than 10 nm. Conversely, scanning Fabry-Pérot MEMS sensors provide the worst resolution — typically between 15 and 20 nm. Current DMD spectrometers can provide resolution in the range of 10 nm.
Scan speed — The DMD spectrometer, Fabry-Pérot MEMS sensor, and scanning grating monochromator are all devices that essentially scan through the entire wavelength range. Scans typically last on the order of one second, hence the scan rate of 1 Hz. The diode array spectrometer, however, reads the entire spectrum simultaneously for all wavelengths and can offer scan rates of several hundred hertz.
Stability — Scanning grating monochromators and scanning Fabry-Pérot MEMS devices rely on the very precise movement of an element in the optical path — either a reflection grating or a semitransparent mirror. For this reason, both technologies are very sensitive to external vibrations, shocks, and temperature changes. Diode array- and DMD-based spectrometers, however, are both built without moving parts and are therefore much less sensitive to
environmental factors.
Cost — Based solely on the cost of the
optical NIR sensor — rather than on
that of the complete instrument, including light source, sampling optics, software, and cabinet — Fabry-Pérot MEMS sensors are the lowest-cost option for high volume, whereas diode array and monochromator sensors are the highest-cost option. DMD-based spectrometers are priced in the midrange.
Of the available NIR sensor technologies, a diode array spectrometer may still be the only option if high resolution or high speed is required. Scanning grating monochromators are not suited for PAT due to their sensitivity to vibration; and even though Fabry-Pérot MEMS devices offer a very attractive price point, they too are unsuitable for PAT due to vibrational sensitivity. Overall, however, DMD-based spectrometer technology offers a cost-
effective, rugged alternative to diode array spectrometers as the preferred NIR sensor for PAT applications.
Meet the author
Thomas P. Rasmussen received a doctorate in optics from the Technical University of Denmark in 1994. He has been a vice president at Ibsen Photonics A/S for the past 10 years, focusing on spectroscopy; email: [email protected].
References
1. D. Xiang and M.A. Arnold (2011).
Solid-state digital micro-mirror array
spectrometer for Hadamard transform
measurements of glucose and lactate in aqueous solutions. Appl Spectrosc, Vol. 65, Issue 10, pp. 1170-1180.
2. FDA (October 2004). PAT — A Framework for Innovative Pharmaceutical Development, Manufacturing, and Quality
Assurance: Guidance for Industry.
Document No. FDA-2003-D-0032.