NATALIYA DEYNEKA DUPRIEZ AND TIM NÖBAUER, LESSMÜLLER LASERTECHNIK GMBH
Laser oscillation welding is finding increased popularity in the domain of large-scale industrial production. Through extensive studies examining the welding of aluminum and steel with oscillating laser beams at the commonly used frequencies of 100 to 200 Hz, results showed that oscillation welding is more controllable, offers higher welding speeds, and leads to a reduction in weld defects. The studies have also shown that this process provides significantly reduced weld porosity, a shallower heat-affected zone (HAZ), and an enlarged joining area.
The improved weld quality can be gauged in terms of weld morphology as well as mechanical, electrical, and thermal properties. This improved quality is a prerequisite for series production of battery systems, to achieve high-quality cell connections with minimized electrical and thermal losses and to ensure the highest achievable levels of safety and performance.
For laser oscillation welding, scanning mirrors and lenses are used to manipulate the beam. With these elements, the laser focal point can be moved in a circular or other pattern in conjunction with the welding feed. Additionally, the oscillation shape, amplitude, and frequency can be adjusted.
However, obtaining control of laser penetration at different combinations of welding conditions — as determined by laser power, welding speed, oscillation frequency, and welded material — remains an open issue. An uncontrolled penetration of the laser beam during the joining process poses a safety risk when the welded workpiece is in operation. It is now obvious that a suitable manufacturing process is essential to fulfill the strict necessary technical requirements.
To this end, several technological solutions for real-time monitoring of the weld depth during laser beam oscillation welding have been presented. In many cases, these proposed methodologies have also undergone optimization. For example, x-ray videos along the oscillation path have been used to visualize and analyze the geometry of the keyhole1. However, commercial x-ray systems pose too many restrictions for use and application in mass production.
Another study has shown the effect of circular oscillation patterns along the linear feed direction on the keyhole depth measured using in-line coherent imaging during the laser welding of copper and aluminum2. Here, a static measurement beam was used to capture measurements at four cardinal points around the circular oscillation pattern, or a beam was rotated in the opposite direction relative to the process beam when the keyhole and measurement beam crossed several times per oscillation period.
Optical coherence tomography (OCT) is the modern technology that has been used to monitor and control the industrial laser welding process. Microsecond-scale temporal resolution and high measurement accuracy at micrometer scale are achievable with OCT. The outstanding precision of OCT can streamline processes, increase overall efficiency and productivity, and lead to cost reductions.
But the major drivers to the intensified use of OCT for this monitoring application during the last decade involve its ease of integration into the welding system, plus its immunity to the process environment. The OCT measuring beam is directed coaxially onto the workpiece surface together with the processing laser beam and used to inspect the surface topography in the pre- and post-welding stages for the seam tracking and quality assessment of the weld bead. OCT also enables direct noncontact in-process measurement of the weld depth to control the consistency of the penetration of the processing laser.
In-process monitoring: Aluminum
In previous work, a true following mode was explored, in which the weld depth was continuously measured with OCT using a newly developed procedure3,4. This procedure enabled high-dynamic adjustment of the OCT beam position to the instantaneously modified processing direction, allowing it to follow any welding trajectory and any oscillation geometry.
This was realized via an adjustment of the OCT beam position to the position of the processing laser due to the high-dynamic communication of the control board with both the laser processing optics and an OCT scanner. A 2D galvanometer OCT scanner was used for dynamic beam deflection. The weld depth was measured with OCT in real time during the welding of the as-rolled aluminum workpiece.
The use of an aluminum workpiece is typical for the fabrication of automotive battery components. The processing beam with a laser power of 2.5 kW followed a circular oscillation path in a clockwise direction — with an oscillation frequency of 150 Hz and an oscillation amplitude of 0.8 mm — which was superimposed on the circular feed trajectory with a welding speed of 95 mm/s (see the table).
Exemplary results of weld depth measurements with OCT were obtained during welding along three oscillation loops in the middle time of the entire weld seam (Figure 1). Figure 1 also shows the oscillating behavior of the weld depth as a function of the rotation angle. This behavior is repeated over the entire welding time.
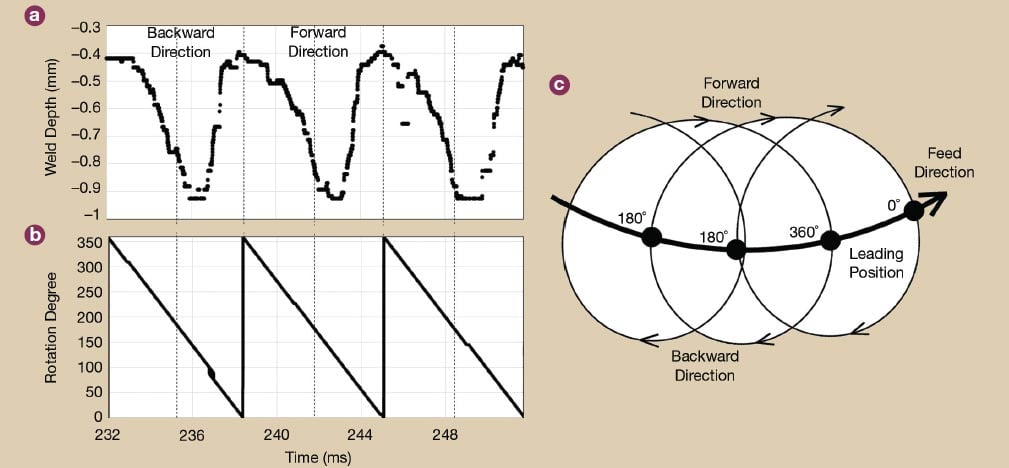
Figure 1. Data showing optical coherence tomography (OCT) weld depth measurements (a) in relation to rotation degree (b) during the laser beam oscillation welding of aluminum alloy. This information is compiled along three oscillation circles (c). The schematic represents the laser beam position within the oscillation circle. Courtesy of Lessmüller Lasertechnik GmbH.
A clear difference in the weld depth was observed at different positions within the oscillation circle. Measurements at the front point (leading position) of the feed direction (radial angle 0° or 360°) showed the shortest keyhole. The deepest keyhole was observed at the beginning of the forward movement, in relation to the feed direction, at a rotation angle between ~90° and 180°.
Monitoring of the PMMA welding
Figure 2 shows a simple and cost-effective test setup used to confirm the OCT weld depth results obtained when welding aluminum with an oscillating processing laser beam and high-dynamic OCT beam. Subsequent processing was performed on the edge surface of a polymethyl methacrylate (PMMA) sheet with a thickness of 3 mm to enable sheet transparency for sideward video recording of the processing. A single-mode laser with a power of 200 W was used; welding speed along the line was 100 mm/s; and the average speed over the entire oscillation path was 262.08 mm/s. An OCT laser welding optic equipped with an f-theta lens, with a focusing distance of F = 400 mm, was used to position the laser beam (Figure 2).

Figure 2. Test setup: welding and testing equipment and installation (a); a schematic presentation of the laser welding and testing setup (b); a schematic presentation of the post-process scanning of the finished seam surface with OCT (c). Courtesy of Lessmüller Lasertechnik GmbH.
The process conditions are shown in the table; except for the laser power and oscillation radius, they are similar to those used for aluminum welding with an oscillating laser beam. The laser power was reduced due to the much lower melting temperature of PMMA compared with aluminum, while the oscillation radius had to be adapted to the PMMA sheet thickness.
A high-speed camera was used to record the welding process, and the video was recorded at a rate of 8986 fps at a resolution of 640 × 120 pixels. The sheet was recorded from the side so that the HAZ could be seen, owing to the transparency of this material.
The cross-jet was used to suppress the bubble formation on the surface of the sheet during laser processing, which occurred as a result of boiling.
Laser Oscillation Welding: Process Steps and Results

Courtesy of Lessmüller Lasertechnik GmbH.
The surface topography of the resulting weld was analyzed in the post-process after completion of the weld. OCT measurements with a line rate of up to 250 kHz were performed by taking 100 measurements per line. The length of the OCT scan line across the weld was 2 mm. The theoretically estimated axial resolution of the OCT is ~12 µm.
The melting temperature of the PMMA is 160 °C, and it burns at 460 °C. The application of the high-energy processing laser beam therefore leads to boiling and vaporization of the synthetic polymer. Therefore, the surface scan with OCT over the fully solidified weld seam represents the topography profile of the weld crater (Figure 3).
The topography of the weld craters repeats the oscillating motion of the laser beam; this is similar to that which has been observed previously2. Superimposing the crater depth with the oscillation path showed that the crater is deepest when the oscillation circles intersect, and shallowest when the laser beam moves forward along the feed direction and melts the raw material. A certain discrepancy in the measurement results is due to the scattering of the reflected OCT beam on the rough crater surface. In the circular oscillation pattern, the laser beam moves periodically along and against the welding direction3. The crater depth does not provide information about the penetration depth during the forward and backward movement of the processing laser.

Figure 3. Data showing weld crater topography (lower diagram) after the laser beam oscillation welding of polymethyl methacrylate (PMMA) with an oscillation frequency of 100 Hz in relation to the trajectory of the laser beam (upper diagram). From the diagrams, the deepest craters occur when the circular movements overlap. Courtesy of Lessmüller Lasertechnik GmbH.
Side-view snapshots of the processed PMMA material with and without laser beam oscillation confirm this observation: The almost linear underside of the HAZ is visible after processing without oscillation (Figure 4a). With oscillation welding, the underside of the HAZ shows an oscillating character (Figure 4b-d). It is also noticeable that the welding speed influences the shape of the resulting HAZ. The higher the welding speed, the more the cavity extremes spread out. The resulting data shows that the underside of the HAZ tends toward linearity at lower welding speeds.

Figure 4. Side-view snapshots of the processed polymethyl methacrylate (PMMA) without (a) and with (b-d) laser beam oscillation at varying welding speeds. Courtesy of Lessmüller Lasertechnik GmbH.
The crater topography and the snapshots of the solidified weld seam represent the resulting weld seam in the same way as the metallographic cross-sectional images. It is important to know how the weld forms during the welding process to control and predict the quality of the joint. OCT keyhole depth measurements can shed light on this.
Similar to the x-ray video recording of the metallic workpiece previously referenced, the lateral video recording of the PMMA can track the laser penetration depth and the evolution of the HAZ during processing with the oscillating laser beam and resolve each melting stage (Figure 5). The oscillation frequency, radius, and welding speed differed from those used for welding aluminum. Since lower welding speeds, or higher oscillation frequencies and radius, lead to an almost linear underside of the HAZ, a frequency of 100 Hz, radius of 0.4 mm, and a welding speed of 100 mm/s were chosen to resolve each oscillation cavity individually.
In Figure 5, the sequence of snapshots from the lateral video recording of the weld formation during welding along the first and second oscillation loop is shown. The development of the HAZ in the feed direction can be observed in the first five stages of Figure 5. In these five stages, the HAZ gradually expands in length and depth. When the processing laser moves backward, a further deepening of the already welded portion is noticed (Figure 5, stage 6), which reaches its maximum when the oscillation path overlaps (Figure 5, stage 7). A similar behavior was detected when the laser beam moved along the second oscillation loop (Figure 5, stages 8 to 14).

Figure 5. Video snapshots (a) (stages 1 to 14) of the successive development of the heat-affected zone (HAZ) within two oscillation loops during the laser beam oscillation welding of the polymethyl methacrylate (PMMA) with an oscillation frequency of 100 Hz. The position of the laser beam at each snapshot time is marked on the schematic to show laser beam trajectory (b). Courtesy of Lessmüller Lasertechnik GmbH.
Analysis of results
A comparison of the results of the video recording of the second loop in Figure 5, with the OCT measurements of the weld penetration depth during oscillation welding of aluminum shown in Figure 1, reveals multiple similarities. Notably, the weld formation during welding with an oscillating laser beam is subject to continuous dynamic changes depending on the temperature and the welding speed.
To cover the longer distance within the oscillation path during forward movement, in relation to the feed direction, the laser beam was advanced onto the aluminum workpiece at a maximum speed of 848.98 mm/s and onto the PMMA at a maximum speed of 351.33 mm/s. Higher welding speeds typically cause shallower welds. However, during the forward movement, the laser beam interacted with molten material due to the crossing of the oscillation circles (except the very first stages 1 to 5), at rotation degrees 180° to 90° and at stages 7 and 13 in Figure 5. The molten material vaporized quickly, resulting in a significant increase in weld depth and HAZ.
When traveling backward in relation to the feed direction, the processing beam covers a shorter distance. On the aluminum workpiece, the minimum speed of the backward movement was 658.98 mm/s, while the laser beam on the PMMA moved backward at a minimum speed of 151.33 mm/s. At lower welding speeds, during backward movement, a deeper weld would be expected. Nevertheless, the shortest keyhole and HAZ were observed in the earlier stages of the backward movement when the laser beam melted the solid material (Figures 1a and 5a). The weld depth and HAZ increased progressively at rotation degrees of 250° to 180° (Figure 1b) in stages 5 and 6 of Figure 5 due to the proximity of the weld pool. A similar 3D model has been previously presented5.
The results indicate that the proximity of the already-melted areas has the greatest influence on the laser penetration depth. The welding speed during the forward and backward movement of the laser during circular oscillation welding has less influence on the weld formation.
The results additionally emphasize the value of high-dynamic OCT measurements with synchronous online reorientation of the OCT measurement beam in relation to the dynamically changing processing beam position. OCT allows not only control of the consistency of the laser penetration in real time but also the monitoring of the time-resolved weld seam formation. Knowledge of the weld depth dynamics is essential for a stable and controlled weld depth and exceptional weld quality. Moreover, the use of high-dynamic OCT ensures the effective production, high throughput, and optimum performance of the manufactured parts.
References
1. F. Fetzer et al. (2018). Reduction of pores by means of laser beam oscillation during remote welding of AlMgSi. Opt Lasers Eng, Vol. 108, pp. 68-77.
2. C.M. Galbraith et al (October 2018). Wobble-welding of copper and aluminum alloys with inline coherent imaging. Proc ICALEO, Vol. 37, Orlando, Florida.
3. N. Deyneka Dupriez et al. (2023). Weld depth dynamics measured with optical coherence tomography during remote laser beam oscillation welding of battery system. J Laser Appl, Vol. 35.
4. N. Deyneka Dupriez (June 2023). Measurements of weld quality with OCT during laser beam oscillation welding of aluminum alloy for battery production. Proc Lasers in Manufacturing Conference 2023, Munich, Germany.
5. T. Li et al. (2024). Weld formation and porosity in TC4 joint by oscillating laser beam welding with circle trajectory model. J Mater Res Technol, Vol. 30, pp. 2680-2689.