Photonics HandbookFeatures
Raman and Laser-Induced Breakdown Spectroscopy Augment Chemical Analysis
By combining complementary detectors and fusing their data, these technologies work together to examine samples and detect conditions such as cancer, including melanoma.
By Amy Bauer
Raman spectroscopy and laser-induced breakdown spectroscopy (LIBS) are two laser-based optical methods that provide complementary insights into the chemical composition of materials. Raman spectroscopy identifies molecular structures by detecting how light scatters when it interacts with chemical bonds. In contrast, LIBS reveals elemental composition by using a high-energy laser pulse to produce a microplasma from the sample, then analyzes the light emitted by the resulting excited atoms and ions. Each of these techniques provides valuable but distinct information useful for both biological and materials analysis — and when combined, the two spectroscopic approaches can deliver a much more complete understanding of a sample’s composition.
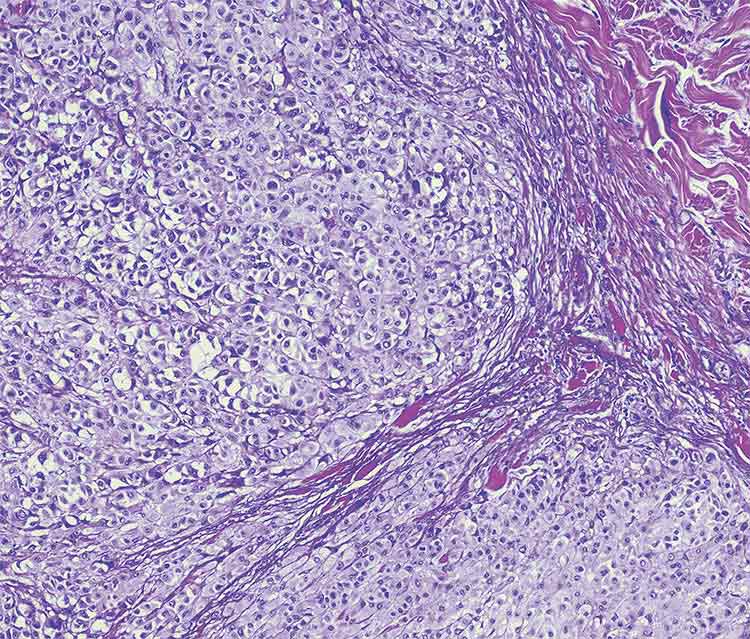
Metastatic melanoma. Courtesy of iStock.com/OGphoto.
In literature reports, tandem Raman-LIBS has been realized in two different ways: through hardware integration or data-level combination. In other words, researchers can design systems that physically combine both techniques into a single setup, or they can collect data separately and merge the results computationally. This flexibility is rare in analytical instrumentation and opens up multiple paths for tailoring the method to specific research needs. The choice of approach can depend on whether the two measurements must be taken simultaneously to analyze the same material. Biological measurements are an example of systems that may evolve over time, supporting the use of the integrated hardware. Integrated hardware is also recommended when both techniques must sample the exact same location, as in the case of heterogeneous samples.
Some of the most elegant implementations of the tandem approach use a shared laser and detector to collect both Raman and LIBS signals. In Johannes Kiefer’s 2024 study, for example, a single Q-switched Nd:YAG laser pulse was shaped into two temporally separated pulses1. The first, lower-intensity pulse was optimized to capture the Raman signal, while the second, high-energy pulse triggered the plasma used for LIBS. These pulses were carefully timed so that the Raman signal was collected just before the plasma disrupted the molecular structure of the sample. Both signals were recorded using a single, time-gated detector.
This setup allowed for near-simultaneous acquisition of molecular and elemental data from the same sample point, making it well suited for dynamic (timed) or remote measurements. In the study, this approach was demonstrated on room air and illustrates the benefits of applying the two techniques nearly simultaneously to a transient system1.
Although Kiefer’s system focused on demonstrating the instrument design rather than on extensive data analysis, it laid the groundwork for real-time chemical analysis in which both types of information can be captured in a single laser shot.
Yujia Daia and a group from Zhejiang A&F University extended this approach to the study of solid mineral samples, also using a single laser and detector to collect co-registered Raman and LIBS data2. Daia’s approach differed from Kiefer’s principally in that the energy of the laser pulses was attenuated for the Raman analysis, and the Raman and LIBS data were acquired with different laser pulses at the same location (Figure 1). The timing of the analysis was important: Raman measurements were performed first because the technique is nondestructive (Figure 2). LIBS analysis was performed afterward because, although it causes minimal damage to the surface, it still alters the sample, hindering the reliability of subsequent measurements.
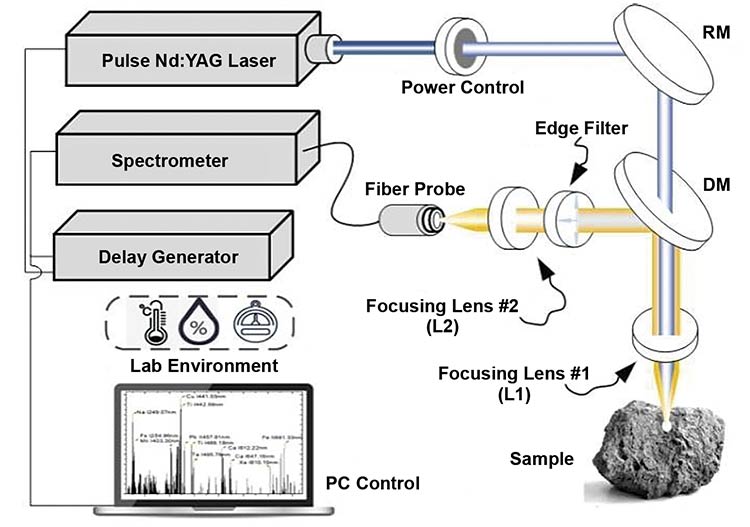
Figure 1. A schematic rendering of the time-gating laser-induced breakdown spectroscopy and Raman spectroscopy (LIBS-RS) measurement system. DM: dichroic mirror; RM: reflection mirror. Adapted with permission from Reference 2.
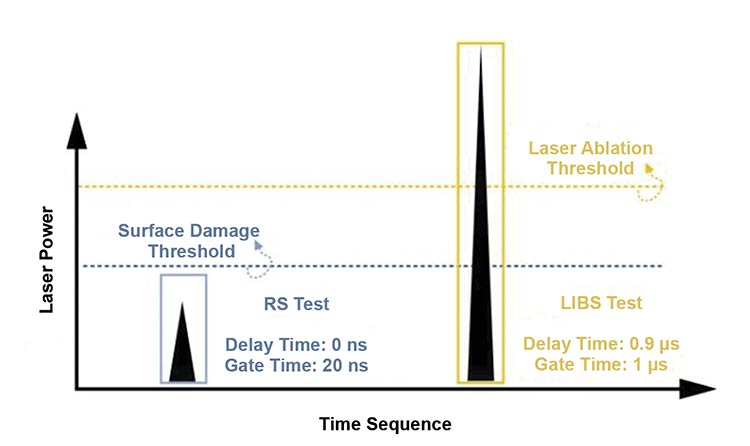
Figure 2. A signal generation timing diagram. LIBS: laser-induced breakdown spectroscopy; RS: Raman spectroscopy. Adapted with permission from Reference 2.
Data analysis
An important innovation is the use of machine learning to interpret the combined spectral information. Preprocessing techniques such as baseline correction, followed by dimensionality reduction using methods like t-distributed stochastic neighbor embedding, reveal clusters in the data. Also, feature ranking using Fisher scores helps to identify the most important spectral features, enabling researchers to highlight those that reveal specific details about the sample.
Supervised learning algorithms such as partial least squares-discriminant analysis and kernel-based extreme learning machines are then used for classification. Zhao’s study resulted in >98% accuracy in distinguishing among six similar mineral types, showcasing the analytical power of fused molecular and elemental data. These results were better than those from the individual LIBS and Raman spectroscopy analyses and demonstrate the benefit of fusing data from the two techniques.
Perhaps the most well-known example of hardware-integrated Raman/LIBS is the SuperCam instrument aboard the Perseverance Mars rover3 (Figure 3). Raman and LIBS data in this case were developed using a combined collection telescope but shared the same Nd:YAG. The Raman excitation was provided by frequency-doubling the laser output. Each measurement used its own spectrometer: LIBS detection was performed with a dedicated three-channel spectrometer covering ~240 to 850 nm with high resolution. Raman detection used a time-gated intensified CCD spectrometer optimized for detecting weak signals and rejecting background light.
Figure 3. An image of the Mars Perseverance rover, which houses the SuperCam instrument. Courtesy of iStock/dima_zel.
The principal data product from both LIBS and Raman in this case was geological in nature. Raman spectroscopy was used to identify minerals, while LIBS data provided quantitative elemental data on both rock and soil. These two instruments have provided valuable evidence of past water activity through the discovery of evaporitic materials.
Clinical applications
In contrast to hardware integration, tandem Raman-LIBS can also be achieved by collecting data separately and merging it during analysis. Muhammad Nouman Khan’s group adopted this strategy in a biomedical context, studying formalin-fixed paraffin-embedded tissue samples to distinguish between melanoma and normal skin4. The goal of the research was to supplant traditional pathology techniques with instrumental methods requiring less sample preparation and operator training. They acquired Raman and LIBS spectra independently, then treated the combined data sets with machine learning techniques.
Normal skin and melanoma lesions differ in moisture and texture. Melanoma tissue is significantly drier and harder than normal tissue. Changes in water content and rigidity may be attributable to differences in the tissue’s main constituents. Additionally, surface hardening decreases the complexity of laser ablation on soft tissue by removing some of the impact of water quenching of plasmas, making successful LIBS signals easier to collect. The surface hardness may cause stronger spectral signals in the melanoma sample, as well as stronger calcium, magnesium, phosphorus, and potassium lines.
This approach highlights a different kind of complementarity. While Raman spectroscopy captures the biochemical characteristics of tissues — such as proteins, lipids, and nucleic acids — LIBS adds information about the presence of trace elements, influenced by tissue moisture. Together, the two methods offer a more comprehensive picture of the sample for diagnostics. Even though the measurements are taken on different instruments, data fusion enables accurate classification, demonstrating that spatial or temporal separation does not necessarily limit the value of combined analysis — provided the fusion strategy is robust.
Geer Teng and coworkers present a strategy for fusing LIBS and surface-enhanced Raman data to improve classification of bacteria using support vector machines5. Two feature-level data fusion methods were used: before feature selection fusion (BFSF) and after feature selection fusion (AFSF). Both methods reduce the large dimensionality of combined spectral data sets and minimize computational time while retaining or improving classification accuracy.
In BFSF, the full LIBS and Raman spectra are first concatenated, normalized, and then reduced via feature selection using the Random Forest algorithm. In contrast, AFSF first independently selects key features from the LIBS and Raman spectra and then fuses those reduced sets. The AFSF method was found to outperform BFSF when using fewer features, achieving up to a 99.33% correct classification rate with only 10 data points and ~0.2 s analysis time using fixed support vector machine parameters. BFSF achieved up to a 100% correct classification rate when more features were used, but this came at the cost of increased complexity.
The data showed good separation of clinically important bacteria, including three types of Escherichia coli (TG1, JM109, and 44113), two types of Staphylococcus aureus (26068 and 26003), and one type of Bacillus cereus (63301).
Bacteria classification using Raman/LIBS data fusion was also investigated by Jozef Kaiser’s research group. In this work, six strains of bacteria were also classified — one strain of E. coli and five of S. aureus, including one resistant strain — using multivariate analysis6. Principal component analysis was first applied for dimensionality reduction and visualization, and self-organizing maps — a type of neural network — were introduced for supervised classification. LIBS alone separated three strains well, Raman two, but full discrimination of all six strains was achieved only when spectral data from both methods were merged into a single data set.
A third strategy, demonstrated by Ulrich Panne’s group, involved a dual-path spectrometer in which Raman and LIBS each had dedicated optical components optimized for their respective signal types7. The system used a dual-arm Echelle spectrograph (which uses a diffraction grating), with both signal paths feeding into a shared detector. This approach allowed simultaneous detection from the same micrometer-scale sample location without compromising the optical conditions needed for either technique. This work focused on surface and layer analysis of heterogeneous materials, and for this purpose, co-localized elemental and molecular mapping at the microscale was required.
The system was fully automated to permit fast surface mapping of a user-defined area, with each technique sampling the same 50-µm-diameter spot. The Raman and LIBS data, each collected in one arm of the double Echelle spectrometer, were corrected for the Echelle grating blaze function, and fluorescence was removed from the Raman spectra.
Rather than relying on machine learning, this system emphasized spatial resolution and mapping. It proved to be particularly effective for studying layered or heterogeneous materials, such as geological samples, historical artifacts, or tissue samples, where it is important to collect both elemental and molecular information from precisely the same location.
In this case, because of weak Raman cross sections or interfering fluorescence, Raman scattering was not produced at every spot. The ability to produce signals in all samples is important for those without Raman signals, but one benefit of the twinned analysis is that where Raman reveals crystal forms and specific bonding information, LIBS can be made semiquantitative. This is useful for differentiating between similar samples.
Lastly, this work described the use of Raman-LIBS depth analysis. As the LIBS laser processes the surface, it can reveal more information about the in-depth composition of a complex material such as a heterogeneous rock sample or cancerous tissue.
Hurdles to widespread use
Despite the clear benefits of combining Raman and LIBS, literature reports of tandem usage in active experiments remain relatively uncommon compared with the application of one technique or the other. One reason is the mismatch of hardware requirements: Raman spectroscopy relies on low-intensity light and highly sensitive detectors, while LIBS requires powerful laser pulses and detectors that can handle rapid, high-energy emissions. Balancing both needs in one system involves careful optical design and precise timing. Combining the two methods in one instrument is expensive and complicated, and coupled molecular and elemental data are not often required to solve an analytical question.
Even when hardware integration is avoided, combining the data still requires advanced processing tools and expertise in chemometric or machine learning techniques. These methods are not yet routine in most laboratories. Finally, commercially available systems that integrate Raman and LIBS remain limited, and those that do exist are often specialized and costly.
But what makes tandem Raman-LIBS especially compelling for a growing number of researchers is its adaptability. Few analytical techniques can be implemented either by physically combining instruments or by computationally merging data — with equally powerful results. This dual pathway gives researchers the freedom to choose the approach that best fits their experimental conditions, available tools, and scientific goals.
As lasers, detectors, and software continue to evolve — and as machine learning and artificial intelligence tools become more accessible — tandem Raman-LIBS is poised to become a more common and valuable tool in the analytical sciences, and potentially in the clinic. Its unique ability to bridge molecular and elemental information — across both hardware and software — makes it a technique of rare versatility.
Meet the author
Amy Bauer has been a spectroscopist at various companies selling photonics-based instrumentation for most of her career. Her specialties are laser- and spark-induced breakdown and Raman spectroscopy. Bauer has more than 30 peer-reviewed papers in these fields, one patent, and several invention disclosures. She is a LIBS topic editor for Applied Spectroscopy and helps to organize both the Optica Sensing Applied Industrial Spectroscopy symposium and international LIBS conferences; email: amy.bauer@oceanoptics.com.
References
1. J. Kiefer (2024). Simultaneous application of Raman laser-induced breakdown spectroscopy in the gas phase with a single laser and detector. Appl Spectroscopy, Vol. 78, No. 4, p. 438.
2. S. Zhao et al. (2024). Fusion of laser-induced breakdown spectroscopy and Raman spectroscopy for mineral identification based on machine Learning. Molecules, Vol. 29, p. 3317.
3. R.C. Wiens et al. (2021). The SuperCam instrument suite on the NASA Mars 2020 Rover: body unit and combined system tests. Space Sci Rev, Vol. 217, No. 4.
4. M.N. Khan et al. (2022). Evaluation of human melanoma and normal formalin paraffin-fixed samples using Raman and LIBS fused data. Lasers Med Sci, Vol. 37, No. 5, p. 2489.
5. G. Teng et al. (2021). Feature-level fusion of laser-induced breakdown spectroscopy and Raman spectroscopy for improving support vector machine in clinical bacteria identification. J Raman Spectrosc, Vol. 52, pp. 805-814.
6. J. Kaiser et al. (2018). Combination of laser-induced breakdown spectroscopy and Raman spectroscopy for multivariate classification of bacteria. Spectrochim Acta B: At Spectrosc, Vol. 139, pp. 6-12.
7. U. Panne et al. (2009). A combined laser-induced breakdown and Raman spectroscopy Echelle system for elemental and molecular microanalysis. Spectrochim Acta B: At Spectrosc, Vol. 64, pp. 1219-1227.
/Buyers-Guide/Ocean-Optics/c10604
Published: September 2025
Glossary
- spectroscopy laser systems
- Spectroscopy laser systems are specialized setups that utilize lasers to study the interaction between light and matter. These systems are integral to various scientific and industrial applications where precise and detailed analysis of materials is required.
spectroscopy laser system suppliers →
Monochromatic light: Lasers provide a very narrow wavelength of light, essential for high-resolution spectroscopic measurements.
Coherence: Laser light has a high degree of...
- raman spectrometer laser systems
- Raman spectrometer laser systems are specialized tools used in Raman spectroscopy, a technique that reveals information about the vibrational modes of molecules within a material. The core principle involves directing a laser beam onto a sample and analyzing the scattered light. As the laser interacts with the molecules, a small portion of the light undergoes inelastic scattering, resulting in an energy shift that reflects specific molecular vibrations. These energy changes, known as Raman...
- raman spectroscopy
- Raman spectroscopy is a technique used in analytical chemistry and physics to study vibrational, rotational, and other low-frequency modes in a system. Named after the Indian physicist Sir C.V. Raman who discovered the phenomenon in 1928, Raman spectroscopy provides information about molecular vibrations by measuring the inelastic scattering of monochromatic light.
Here is a breakdown of the process:
Incident light: A monochromatic (single wavelength) light, usually from a laser, is...
- laser-induced breakdown spectroscopy
- Laser-induced breakdown spectroscopy (LIBS) is an analytical technique that uses a high-powered laser pulse to ablate a small amount of material from a sample, creating a plasma. This plasma emits light, which is analyzed to determine the elemental composition of the sample.
Principle of operation: A focused laser pulse is directed at the sample, causing rapid heating and vaporization of a small amount of material. The vaporized material forms a high-temperature plasma, which consists of...
- spectrometer
- A kind of spectrograph in which some form of detector, other than a photographic film, is used to measure the distribution of radiation in a particular wavelength region.
Featuresspectroscopy laser systemsRaman spectrometer laser systemsRaman spectroscopylaser-induced breakdown spectroscopyLasersSpectrometer