Andrew MacGregor, Dataray Inc.
Beam intensity profiling is an essential tool in many aspects of industry. The precise intensity distribution is critical in many applications, such as laser plate printing, laser cutting, particle measurement, medical lasers and biomedical instruments. Beam profile measurements improve and monitor products or processes, leading to major cost savings.
This article describes measured intensity distribution parameters, measurement technologies, various limitations, added-value measurements such as profile fits and M2, and how to specify your requirements. It does not address high-power cutting lasers or wavefront measurement, both of which require specialized instruments.
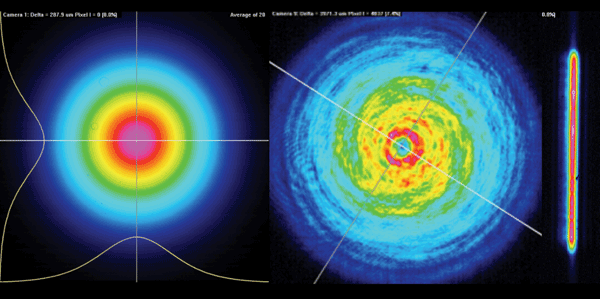
Figure 1. Does your beam look like any of these? How can you measure it?
Typical desired beam profiles are as follows: Gaussian, circular or rectangular “top hat” beams, or linear beams – Gaussian across the line and top hat along the line. A de facto industry-standard definition of “beam width” is the beam diameter at 13.5 percent of the peak intensity. This relates to the Gaussian profile of a perfect TEM00 beam, the nominal output of a single-mode laser or fiber. Additional requirements may include full width half maximum, profile fits, focus position, divergence, pointing and M2.
A top-hat profile is the typical output of a UV excimer laser or a multimode fiber, or of optical manipulation of a beam; the important factors are full width half maximum and flatness. A line profile is generated using cylindrical optics or holograms; uniformity of linewidth and intensity are important here. An array of spots is generated mechanically or optically; array-spacing uniformity and energy distribution are the important factors. For X-Y-Z focusing, a beam waist must be focused at a specific point in space, requiring active alignment. M2 laser beam quality may affect a process.
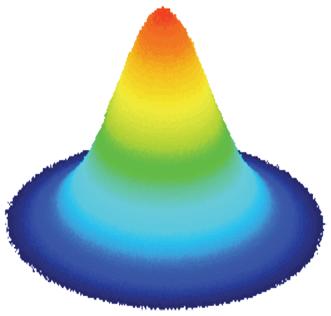
Figure 2. Pure Gaussian beam.
Profiling techniques
Three profiling methods exist: imaging, scanning-slit and scanning knife-edge measurement. Imaging is performed with a camera or raster scan, both of which provide a true image. Scanning-slit gives an intensity profile; an orthogonal slit pair gives X-Y profiles. Scanning knife-edge gives an integral intensity profile; two edges at ±45° give X- and Y-integrals, which can be differentiated to give profiles.
The perfect instrument that covers everything does not exist. You will need to specify carefully and sometimes compromise. A camera-based system with accessories, typically the least expensive option, may meet your essential requirements. If not, consider a slit scanner.
For accurate profiling, the total beam should lie within the sensor area. Adding optics such as beam expanders or reducers, fiber optic tapers and/or microscope objectives may introduce unacceptable levels of optical aberration.
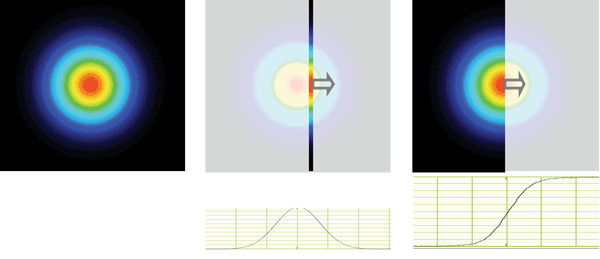
Figure 3. Different profiling techniques include imaging, scanning slit and scanning knife-edge.
Beam images are taken by cameras using 2-D CCD or CMOS sensor arrays, or by scanners that measure transmitted power through a raster-scanned pinhole/probe. You can inspect line profiles at any point on the image. All cameras work on CW beams. Pulsed beams require global (synchronous) shutter capability with a trigger input or an autocapture capability.
If you have low-pulse-rate or irregularly shaped beams, or if you seek a general-purpose profiler, cameras are excellent instruments for beams in the range of ~30 μm to many millimeters. Typical pixel counts are ~350K to ~4 MP. Pixel sizes are from 3.2 to more than 10 μm, with imaging areas up to 20 × 15 mm. The smallest feature measurable is limited by pixel size. Below ~10 pixels, beam diameters are position dependent. Windows are, or should be, removed to avoid interference fringing.
Cameras are appropriate for the following wavelengths: UV to 1350 nm, silicon; 800-1750 nm, InGaAs (expensive); and 2- to 16-µm microbolometer arrays. Interfaces and analog-to-digital converters are commonly port-powered USB 2.0, 3.0 or FireWire interfaced, with 10- to 16-bit analog-to-digital converters.
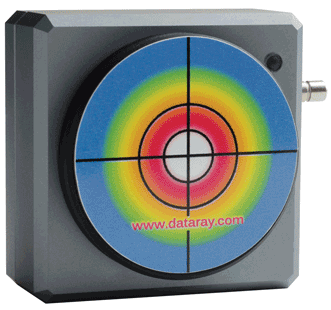
Figure 4. Line profiles can be inspected at any point on the image.
With sensitivity and dynamic range, cameras have a problem: They are often too sensitive. Typically, a neutral-density filter (angled to avoid fringing) blocks the room lights. Cameras and neutral-density filters are wavelength dependent. Curves will show the range of power/pulse energy handled versus both beam diameter and wavelength. Look for continuous autoexposure over the 10,000:1 range. Additional sampling or attenuation can increase dynamic range and power handling. For pulsed-beam single-pulse capture, autoexposure does not help, but sensor amplifier gain and/or variable attenuators can.
The divergence, collimation or focus position of a beam can be determined by moving a single-plane profiler in Z, but this is not a real-time measurement and limits manual or automatic beam adjustment. Multiplane real-time profilers offer major time and cost savings in such applications.
M2 characterizes a real-world laser beam. It is the ratio of the far-field divergence of the beam to that of a perfect TEM00 beam with the same waist diameter. M2 = 1 is diffraction-limited TEM00 perfection. The closer to 1, the more tightly the beam can be focused for cutting, scribing, counting particles, etc. Beam diameter varies hyperbolically with Z distance from the beam waist. Measuring diameter relative to Z determines the M2 value. ISO 11146 defines exact requirements for M2 measurement.
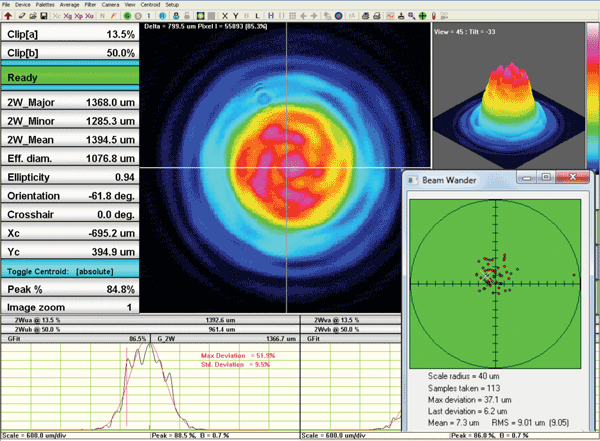
Figure 5. Wavelengths; interfaces and analog-to-digital converters; sensitivity and dynamic range.
Slit and knife-edge scanners generate X-Y beam profiles in single or multiple planes. They move a slit or knife edge between the beam and a single-element detector, which is good for beams close to Gaussian, but they integrate beam structure along the line of the slits.
They offer the high resolution for small beams and cover wavelength ranges not available in reasonably priced camera systems. While they do not give an image of the beam, in many cases X-Y or X-Y-ZΘΦ profiling is all that is required.
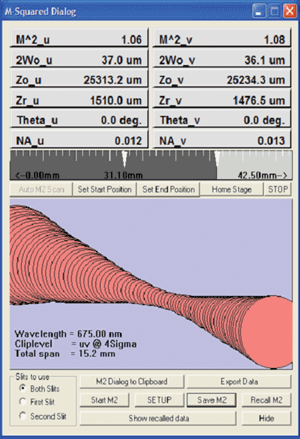
Figure 6. M2 is the ratio of the far-field divergence of the beam to that of a perfect TEM00 beam with the same waist diameter. M2 = 1 is diffraction-limited TEM00 perfection.
Slit and knife-edge scanners provide a smooth profile, avoiding the pixelated profiles of cameras and directly measuring beam powers in the microwatt to many-watt range (diameter dependent) without intermediate attenuators (specialist versions handle up to 100 W). As the beam diameter approaches the slit width, better software compensates for the profile-widening effect of a slit (which matters for beams below about 10 slit widths).
With knife-edge scanners, the differentiated intensity integral generates the beam profile; the sampling rate determines effective resolution. Differentiation increases high-frequency noise, trading resolution against the signal-to-noise ratio.
For pulsed beams, all scanners compromise between pulse repetition rate, update rate, averaging and minimum beam diameter; the manufacturer can provide more information.
Software options vary with differences in display approaches and functionality. Do you need basic functions or sophisticated fits, logarithmic profile display, data logging, beam-wander information, Active X or LabView software interfacing for automated alignment, etc.?
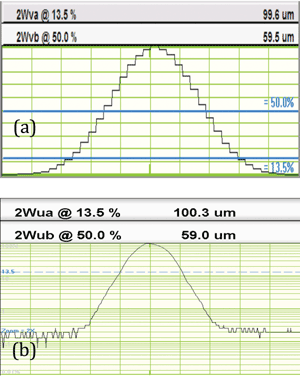
Figure 7. (a) 4.65-μm pixels on a 100-μm beam. Pixels limit accuracy on small beams. (b) 100-μm beam scanned with a 2.5-μm slit gives a smooth profile. Shown in log mode with a 0.2 percent noise floor.
Example measurements
Some examples represent the state of the art in terms of the dimensions, uniformity and/or irradiance of the generated beams. Due to commercial confidentiality, details that might identify the specific application and/or organization have been changed/omitted.
Example 1: lines of light
Some applications require a thin line of light – for example, intense irradiance for materials processing, curtains of light to detect/count/sort, 3-D printing or biomedical instrumentation. These are created in three generic ways:
? By scanning a laser beam – but if a very thin line is required, the distance over which it will be thin can be very short due to Rayleigh range/divergence limitations.
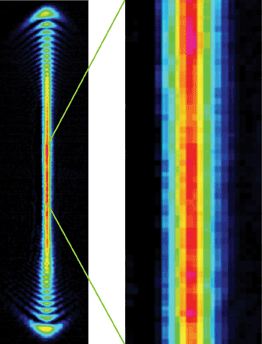
Figure 8. Example 1: lines of light.
? In 3-D printing, by Θ, Φ scanning of a laser beam, with the scanning mirror axis at the focal plane of a telecentric lens.
? If a continuous line of light is required, cylindrical optics on one axis can generate a line of light such as the one shown in Figure 8. The question then arises as to how best to measure it.
A scanning slit integrates along the X and Y axes and gave the first pair of “macro” profiles (Figure 9). Alternatively, it can be measured as an image with a large-area CMOS camera with 5.5-µm pixels; we can set crosshairs and look at the detailed line profiles about various points in Figure 10.
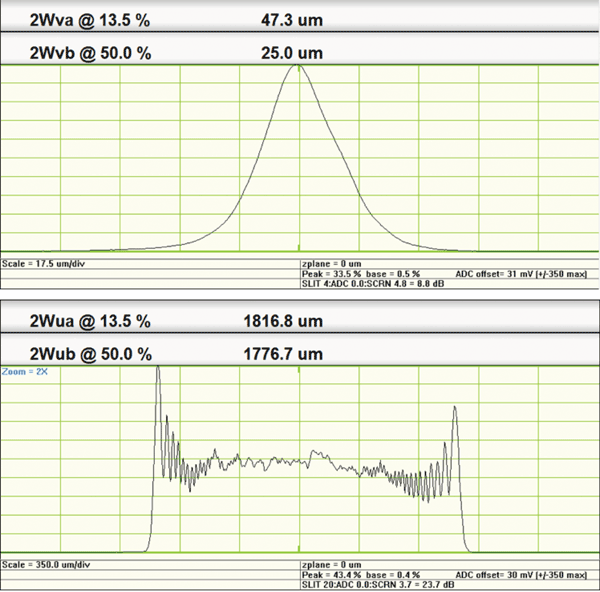
Figure 9. Example 1: first pair of results.
Which is the more appropriate method? This depends on the user requirements. The user may wish to accurately know detail in the smallest beam width in the X direction, but in terms of the total energy scattered by objects passing through the beam, the macro distribution of the integral energy may be most appropriate.
Example 2: lines of light
Materials on a moving belt may be processed on the fly by long beams of high-intensity light. Maximum line speed depends upon the peak irradiance. A perfect profile in this example would be a top hat, with minimal wings above the processing threshold irradiance.
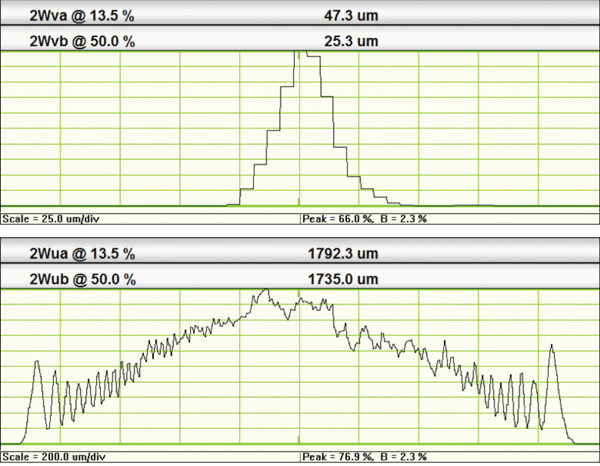
Figure 10. Example 1: Alternatively measured as an image with a CMOS camera with 5.5-µm pixels.
A prototype design measured by a wide-area (25 × 44 mm) raster scan produced the images in Figure 11. The top-hat distribution is well defined and more uniform than with competing systems, and it exceeded any published irradiance at the particular wavelength. The broad and slightly asymmetrical wings can be ignored if they are below the threshold irradiance for the particular process. Without an accurate beam image, it would not have been possible to validate the design.
Example 3: X-Y-Z location and dimensions of laser waists
Some applications – metal surface scribing, foil cutting or biomedical instrumentation – require low- and medium-irradiance (units W/cm2 or J/cm2) focused beams. This requires a beam focus with a specific diameter and at a specific X-Y-Z focus position, sometimes within specific beam-divergence and pointing-angle limits. Real-time adjustment (>5 Hz) requires update of beam waist dimensions and X-Y-Z location, beam divergence and pointing, and/or absolute and relative M2.
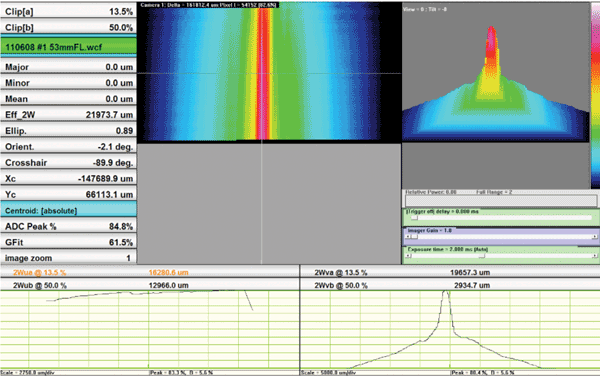
Figure 11. Example 2: lines of light.
If multiple instruments or beams must be adjusted to these same parameters, a single-plane profiler sampling individual Z planes one at a time takes far too long. A system with pairs of X-Y slits in multiple planes in Z has achieved wide acceptance in production environments because it offers a large savings in time. Selected Z-plane spacing puts three planes about the beam waist and one plane in the far field.
The screenshots in Figure 12 show hyperbolic least-squares fitted beam waist curves to the four pairs of points, which are profile diameters from the four
X-Y planes, plus the X-axis data for the four individual planes. Focus changes are tracked in real time and interfaced via LabView or C++ to automated adjustment-control software. This enables real-time update and adjustment of all the parameters listed above.
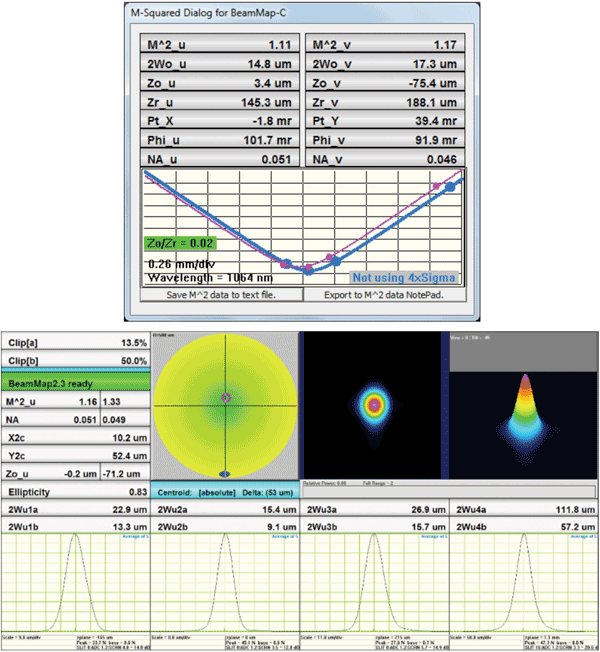
Figure 12. Example 3: X-Y-Z location and dimensions of laser waists.
Example 4: X-Y location and dimensions of high-power laser waists
High-power industrial CW or pulsed cutting lasers are the hardest to handle. If a laser can cut metal, it can do the same to a beam profiler. Some approaches can deal directly with these high-power beams – and are accordingly expensive. Others deal only with sampled beams.
Sampling and attenuation are best performed in the collimated space before the focusing lens. The beam exits an optic that already has the high damage threshold coatings available. As the beam converges to a focus, irradiance may go above levels that any sampling optics can deal with. When this is not possible, some sampling schemes close to the exit optic may help, including reimaging a sample of the beam focus onto a camera or scanning-slit system.
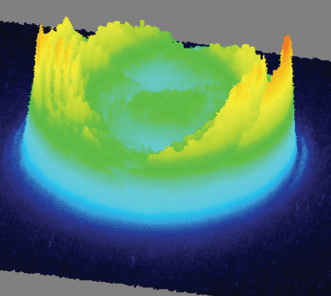
Figure 13. Example 4: X-Y location and dimensions of high-power laser waists.
Example 4 is for a >100-W pulsed beam, sampled after the converging optic. It is a great image of a hollow beam profile – if that is what you seek.
Advice to users
Distinguish the essential measurement requirements from the desirable measurements. Several excellent, cost-effective beam profiling instruments are out
there – along with some indifferent ones. All have a “sweet” range in their specs and may show limitations at the lowest nominal beam diameters. No supplier has a monopoly of excellence across the whole range of instruments and applications.
You will spend anywhere between $2,500 and >$10,000 for your beam profiler. Be clear about what you need to measure, and you should be well satisfied.
Meet the author
Andrew MacGregor is VP of Support at DataRay Inc., Bella Vista, Calif.; email: amacgregor@dataray.com.
Specifying a beam profiler
• Wavelength(s): Broad-wavelength-range system or a limited spectrum?
• CW, pulsed beam: A CW output or a pulsed beam? If pulsed, what repetition rate?
• Beam diameter: Small (microns) or larger (mm or cm)? Defined how?
• Power/energy: Minimum and maximum watts or joules per pulse?
• Accuracy and resolution: What is required?
• Beam X-Y position and wander? Beam X-Y-Z focus position?
• Beam shape: Gaussian, top hat, or line projection?
• Beam divergence, pointing?
• Beam quality: For example, M2 propagation parameter, uniformity?
• Interfacing to LabView, C++, etc.?
/Buyers_Guide/DataRay_Inc/c3455