CHRISTIAN FELSHEIM, HEADWALL PHOTONICS
Oranges are the most popular fruit in the world and make up over half of all citrus fruit produced for food. Florida, Brazil, and China make up over 80% of the world’s orange juice production. Once the fruit is picked, it must be sent to either packing stations or to processing plants, where the fruit is turned into fresh or frozen juice, or concentrate, or further processed into products such as essence oil, d-limonene, or pectin1.
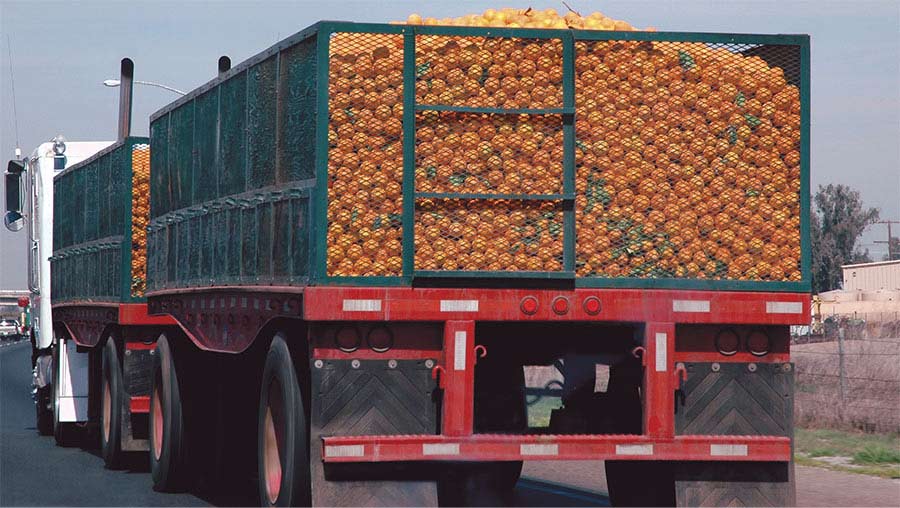
Incoming truckloads of oranges are
evaluated for either packing or processing. An important property is sweetness, which the industry equates with sugar content. Degrees Brix, a unit of measure developed by the sugar industry, is commonly used for single-strength orange juice. Oranges from a truckload are juiced and analyzed in the laboratory with a refractometer or hydrometer. The results determine where each truckload of oranges is to be routed. The process can be slow and labor-intensive.

Truckloads of oranges destined for packing or juicing arrive at processing facilities. Determining whether the oranges should be packed whole or juiced takes time. Juice from a batch is measured for dissolved solids, an analogue for sweetness, and the truckload is dispatched accordingly. Courtesy of Headwall Photonics.
Headwall conducted a study using a Hyperspec MV.X hyperspectral imaging system to rapidly collect spectral data from whole oranges and process it in real time. Algorithms developed by the company predicted the degrees Brix values, which were delivered immediately. This helped to speed up receiving operations, optimize decision-making, and deliver significant return on investment for orange packing and processing facilities.
Beyond RGB
The human eye can only detect images that fall into the visible light spectrum, which lies roughly between 400 and 700 nm. There are only three colors within this range, which fall under the broad red, green, and blue (RGB) regions, and each person’s color sensitivity and perception can vary to a surprisingly wide degree. Humans have trouble distinguishing the difference
between a red-green mixture and a pure yellow, for example.

The full electromagnetic spectrum (top). What normal human eyes can see (color gradient). Multispectral imaging uses four or more fairly broad bands while hyperspectral imaging uses hundreds or thousands of relatively narrow bands for greater specificity (bottom). Courtesy of Headwall Photonics.

Oranges as the human eye would see them in conventional RGB color (a). Pixels representing an assigned degrees Brix value (b). Each orange is represented as an object and assigned a degrees Brix value (c). The plot of measured versus calculated degrees Brix values shows a good level of agreement (d). The images were generated using Headwall’s SpectralView software. Later work was done using perClass (now a part of the Headwall group of companies) Mira software (not shown). The results were comparable, and the Mira workflow was even more intuitive and rapid to deploy. HSI: hyperspectral imaging. Courtesy of Headwall Photonics.
Nevertheless, the food-inspection industry has depended on humans and RGB sensors to detect problems and to grade products for many years. Detection tasks include identifying foreign objects missed earlier in the harvesting process and even identifying hard-to-
spot disease conditions that might be largely invisible to either of these traditional methods.
The stakes are high: Consumer
preference, the ability to meet governmental regulations, and corporate shareholder value can all hinge on the precision and effectiveness of how inspection is implemented across all facets of the food industry.
Spectral imaging sensors can be subdivided into two categories. Multispectral sensors comprise a handful of spectral bands, anywhere from four to dozens, while hyperspectral sensors provide a much more granular look, imaging in high spectral resolution.
Hyperspectral imaging sensors can capture literally hundreds or thousands of spectral bands at a time. They provide a much more complete picture of foods under inspection because they go well beyond the simple RGB or multispectral paradigms and can also provide spatial information such as locations of areas of interest2.

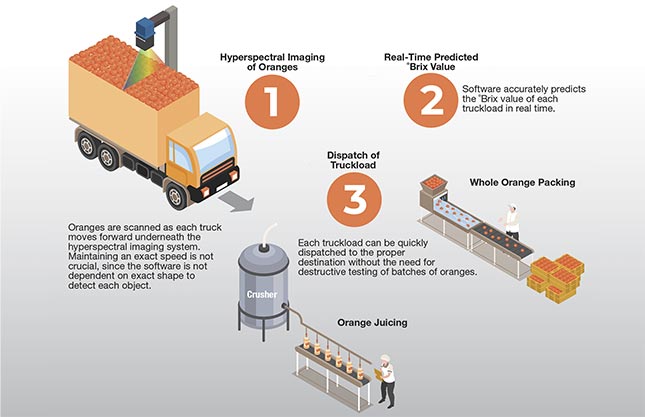
A diagram of the placement of the hyperspectral imaging system over a delivery-truck route at a customer site. Courtesy of Headwall Photonics.
Hyperspectral imaging sensors provide
a much more complete picture of
foods under inspection because they
go well beyond the simple RGB or
multispectral paradigms and can also
provide spatial information such as
locations of areas of interest.
In the study, whole Hamlin oranges were scanned by the hyperspectral
imaging system over the visible-NIR (400 to 1000 nm) range. The oranges were juiced after scanning, and the degrees Brix value of the juice was measured with a digital refractometer. Data from the refractometer was used to train a regression model to predict degrees Brix based on the hyperspectral data. Headwall utilized proprietary software, as well as perClass Mira machine learning software, to analyze the hyperspectral data and generate
a classification model. The model
assigned an image pixel to a class based on the pixel’s spectrum, and a regression model assigned a numeric value to an image pixel based on the pixel’s spectrum. A connected group of pixels in the same class could be recognized as an object.
Based on these models, the software generated a
prediction map in which every pixel is assigned a degrees Brix value. The classification model segmented each orange as a separate object, and the average of all the pixels in
each object resulted in the calculated degrees Brix value
for each orange. A plot of the measured versus calculated degrees Brix values demonstrated a good level of agreement.
The results of this feasibility study have enabled Headwall to deploy a system at a customer site where large quantities of citrus fruit are scanned while right in the truck bed, and the results are used to route each truckload to the proper destination. Field boxes, or entire truckloads of fruit, can be scanned in minutes, and the results are sent to production control stations, saving significant time that would normally be spent juicing to test small samples of each shipment and then obtaining the test results.
Meet the author
Christian Felsheim joined Headwall Photonics as business development and OEM account manager and later became director for the EMEA (Europe, the Middle East, and Africa) region, with a focus on expanding sales and solidifying customer relationships across the region. Since then, he has been the driving force behind the recent successful introduction of the company’s advanced machine vision products; email: [email protected].
References
1. Tetra Pak (2022). Orange book, www.tetrapak.com/
insights/handbooks/tetra-pak-orange-book.
2. GISGeography (2022). Multispectral vs hyperspectral imagery explained, www.gisgeography.com/multispectral-vs-hyperspectral-imagery-explained.