The modulation transfer function is a formula for determining the resolution curve of a lens, quantifying factors such as diffraction and aberrations.
Nick Sischka, Edmund Optics Inc.
There are many different ways to judge the performance of a lens, depending on the application: weight, size, distortion, transmission, and resolution. Of these characteristics, resolution is often the primary cost driver for lenses, with higher-resolution lenses tending to cost more than lower-resolution ones.

Maximizing the price-to-performance ratio for a particular system is critical, and too often buyers may overpay for a lens with higher resolution than needed or, conversely, fail to acquire a lens with a high enough resolution. This may cause designers to turn to cumbersome and less reliable software to make up for the shortcomings of the hardware.
Luckily, there’s a tried-and-true way to calculate the resolution performance of a lens: the modulation transfer function (MTF). In a practical sense, the MTF depicts the resolution capabilities
of a lens; it can be thought of as a resolution curve. Myriad factors affect the MTF of a lens — the two major ones being diffraction and aberrations.
For the purposes of this article,
diffraction within a lens is what sets
the absolute limit in terms of its performance. We’ll examine what criteria have an impact on aberrations —
otherwise known as optical errors — and their effects on the MTF performance of a lens.
Understanding aberrations
Optical engineers classify aberrations into two types: monochromatic and chromatic. Monochromatic aberrations are classified at a single wavelength, but, notably, their relative magnitudes vary with focal length. The individual aberrations are: spherical, field curvature, coma, astigmatism, and distortion. Each one of these optical errors affects a lens’s MTF in a different way, which will be explained in detail later, as will how to potentially mitigate their effects.
Before exploring specific aberrations, it is important to review how to read an MTF curve of a lens. Figure 1 shows
an annotated MTF curve for a high-resolution 12-mm focal length lens.
The x-axis of the MTF curve depicts resolution. Resolution can be thought of from two perspectives: as seen from the object or from the sensor. Resolution from the object’s perspective is the smallest possible object that a lens can image. However, MTF curves do not reflect this definition; instead, they use the image space definition of resolution, which can be thought of as the smallest pixel that the lens can resolve. Of course, lenses can image onto surfaces that are not camera sensors with pixels, but these are impractical for machine
vision; therefore, the aforementioned definition of resolution will suffice here. The units for resolution are given in line pairs per millimeter (lp/mm); unfortunately, this doesn’t equate to anything practical. Luckily, there is an easy way to convert lp/mm into a pixel size, as shown in the following equation where ξ is the frequency (x-axis of the MTF curve).

Some MTF curves (Figure 1) show
a couple of pixel sizes above the x-axis as quick markers to allow the viewer to get his or her bearings. It is important to note that as the frequency increases, it is indicative of a decreasing pixel
size, representing an increase in resolution.
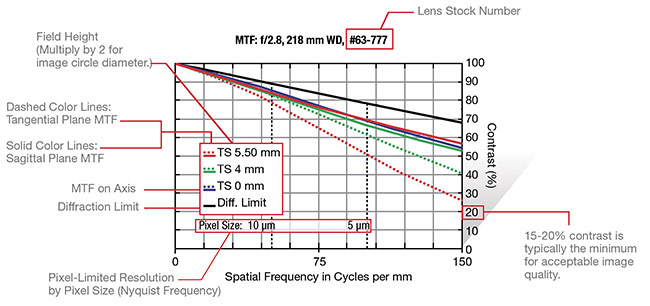
Figure 1. An annotated MTF curve of a high-resolution 12-mm focal length lens. Courtesy of Edmund Optics.
The y-axis of an MTF curve shows the contrast that is attained between any two pixels at a particular frequency; it is the dependent variable for MTF. Contrast is defined as the relative difference in gray level between two adjacent pixels, and it is represented mathematically in the below equation, where I is the relative intensity of each pixel.

Since contrast is unitless, the “relative intensity” can be thought of as the pixel value output by the camera, assuming that a feature wholly takes up one pixel, and that the adjacent pixel is “empty,” with no information occupying it. Figure 2 shows an example of this concept, with repeating pixels in a row showing a contrast reduction with each pixel.
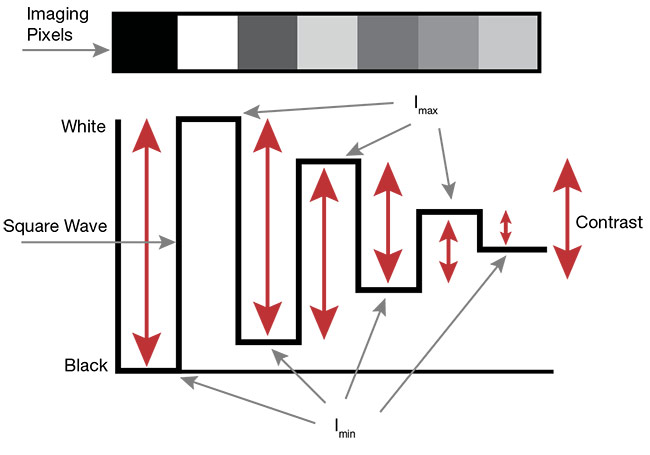
Figure 2. The contrast between a row of pixels, with decreasing contrast at each adjacent pixel. Courtesy of Edmund Optics.
Now that the axes have been defined, note the different curves in the plot in Figure 1, which are the actual performance of the lens. The blue, green, and red curves show the MTF at different field points. In optics, a field point is a spot on the image plane; in the case of an imaging lens, this represents a spot on the sensor. Three common fields are used for MTF curves: Blue represents the center of the field of view, green represents the top of the field of view, and red represents the corner. Figure 1 shows these points
for a 2/3-in. sensor, with an 11-mm diagonal. There are also two varieties
of the red and green curves; these are the tangential (yz) and sagittal (xz) planes. The lines are solid and dashed, respectively. (These lines will be further addressed in the section on astigmatic aberrations.) The higher these individual curves are, the better the lens is. The highest that the curves can go is up against the black line, which is the diffraction limit; a “diffraction limited” lens is functionally perfect.
All lenses will have some amount of spherical aberration, and lenses that have small amounts at low f/#s tend to be quite expensive, as their designs can get complicated. Because of these complications, lenses are usually not designed much lower than f/2.8.
As mentioned earlier, there are many types of aberrations that cause lenses to deviate from perfection. The first, and often the optical error that has the most impact, is spherical aberration. For completeness’s sake, it is defined as the change in focal length with pupil position. This aberration appears in an image as a softness at low frequencies, while generally not ruining the image. It is also constant about the field of view, not varying with xy position. (Figure 3 shows an MTF curve of a 12-mm focal length lens that has a lot of spherical aberration.) Note that the MTF curve sharply drops at low frequencies and then flattens off as the frequency increases. An important note is that the spherical type is the only optical aberration that shows up in the center of the field of view; all others that are addressed here only appear off center.
Spherical aberration is often the type that limits the overall performance of a lens. The reason for this is that its magnitude, which must be controlled for in the optical design, is driven by the f/# of the lens; the lower the f/#, the more the spherical aberration. All lenses will have some amount of spherical aberration, and lenses that have small amounts at low f/#s tend to be quite expensive, as their designs can get complicated. Because of these complications, lenses are usually not designed much lower than f/2.8, though they will often open up to lower f/#s than this. Luckily, spherical is one of the few aberrations
that can be corrected in the field; simply increasing the f/# eliminates the aberration. Figure 4 shows the MTF of the same lens as in Figure 3, but with the f/# increased from f/1.8 to f/2.8. Note the increase in resolution. This is mostly due to the reduction in spherical aberration.
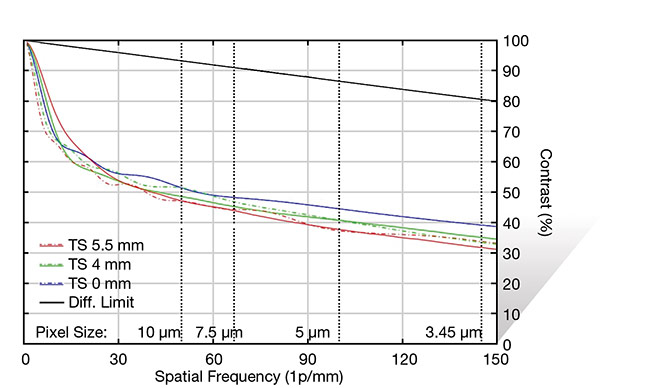
Figure 3. An MTF curve of a 12-mm focal length lens with a lot of spherical aberration. This curve was taken at f/1.8. Courtesy of Edmund Optics..
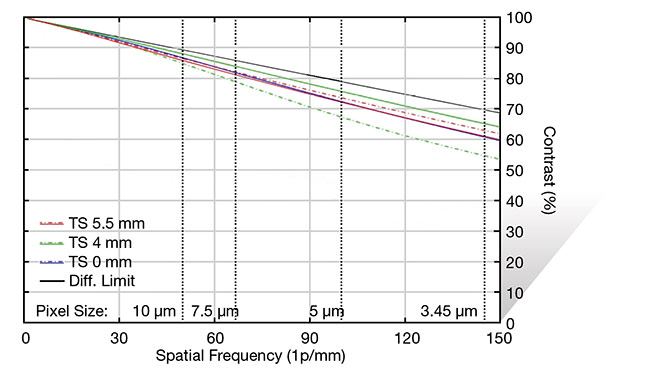
Figure 4. MTF curve of the same 12-mm lens as in Figure 3, but at f/2.8 instead of f/1.8. Courtesy of Edmund Optics.
Field curvature, which is sometimes referred to as Petzval curvature, is the tendency for a lens to focus light onto a curved surface as opposed to a flat one. For most applications of lenses, including machine vision, this aberration tends to create issues because the sensors used in industrial cameras are flat. Most lenses tend to focus light on a plane that bends light toward the lens, as shown in Figure 5.
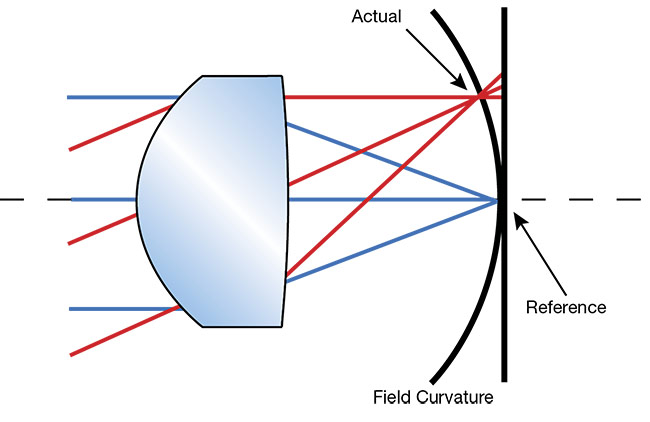
Figure 5. Field curvature in a positive lens. Note that the curve is toward the lens, which is typical of most machine vision lenses. Courtesy of Edmund Optics.
This aberration essentially manifests itself as a blurring that gets worse farther away from the center of the field of view. Figure 6 shows an MTF curve of a lens that has strong field curvature. Note that the blue line (the center of the field of view) has the highest MTF, followed by green, and finally red (the corner of the field of view). This lens was focused best for the center of the field of view, which is a practical mistake that is often made when setting up
machine vision systems. Figure 7 shows a more balanced focus, and while the center performance suffers, overall the lens performs better. Unlike spherical aberration, the amount of field curvature inherent to a lens is not reduced by changing the aperture size.
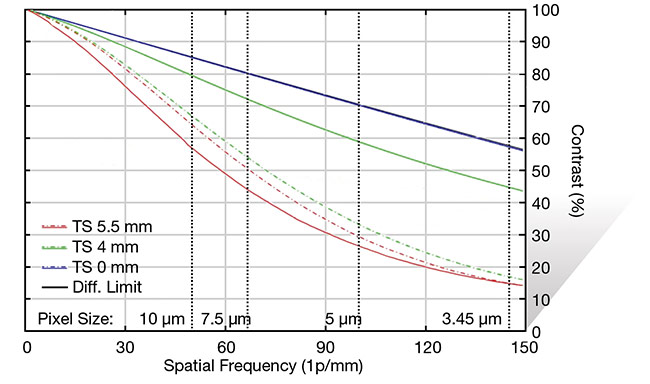
Figure 6. MTF curve of a 16-mm fixed focal length lens showing strong field curvature. Note that the center of the field of view (blue line) is focused the best, and the corner of the field of view (red lines) is the worst. Courtesy of Edmund Optics.
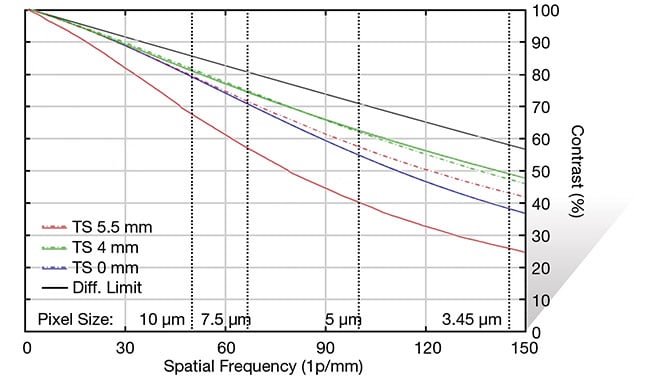
Figure 7. MTF of the same 16-mm focal length lens as in Figure 6, but with the focus balanced to minimize the impact of field curvature. Courtesy of Edmund Optics.
Astigmatism and coma are also affected by aperture size, though not to the magnitude that spherical aberration is. They have been grouped together in this article under the astigmatic type because they both contribute to the splitting of the tangential and sagittal fields, which are represented by the solid and dashed lines in the MTF curve, respectively. Unlike spherical aberration and field curvature, astigmatism and coma are difficult to pick out in an MTF curve, though the magnitude of both is reduced as the f/# increases.
Optical astigmatism is where the focal length of a lens varies based on the field position of rays propagating through the sagittal or tangential planes of the optical system. Practically speaking, astigmatism leads to different resolutions (different MTFs) at different orientations of objects within an image, as shown in Figure 8. Note that the vertical bars are in focus and the horizontal bars are out of focus. This is classic astigmatism.
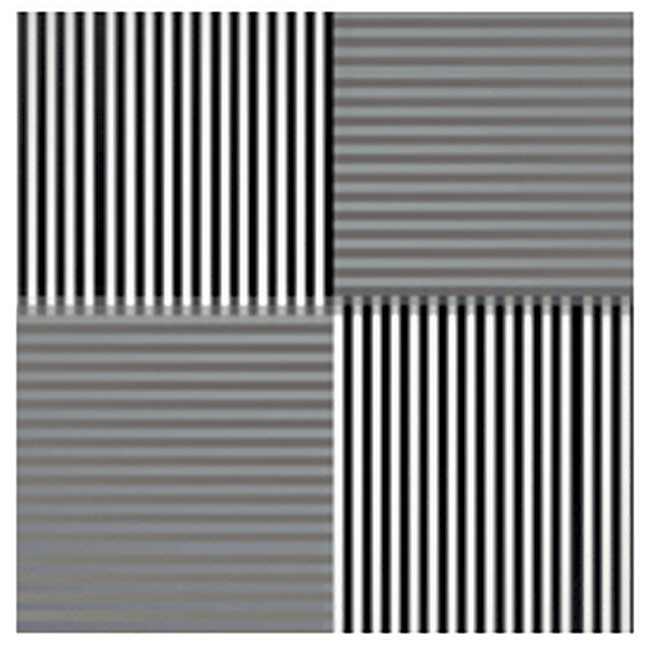
Figure 8. Astigmatism in an optical system. Note the differences in resolution between the vertical and horizontal bars. Courtesy of Edmund Optics.
Coma is a change in magnification with pupil position, showing up in optical systems as bright spots in the corner of the field of view and appearing as comets (hence the name “coma”). Since this aberration is not easily seen individually in an MTF curve, it will not be investigated thoroughly here.
Figure 9 shows a wide-angle lens at f/2.8 and at f/5.6. Note that the solid (tangential) and dashed (sagittal) lines grow closer together as the f/# is increased. This occurs because the magnitude of both coma and astigmatism is decreased as the f/# increases.
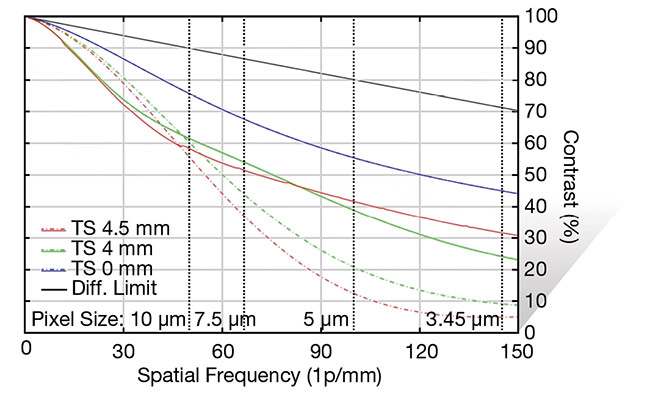
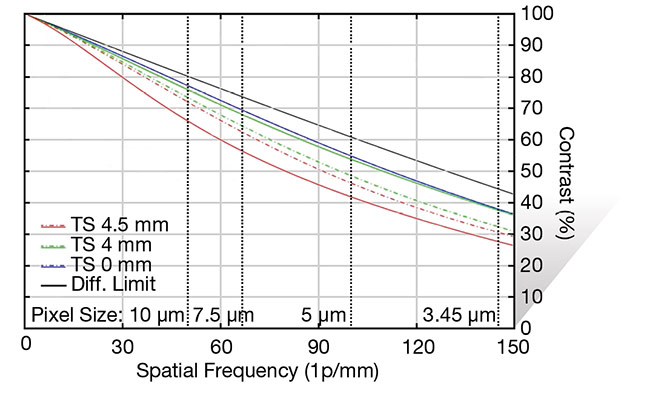
Figure 9. MTF curves of a wide-angle lens showing the reduction in astigmatic aberrations as the lens is adjusted from f/2.8 (top) to f/5.6 (bottom). Courtesy of Edmund Optics.
Distortion is the only optical aberration that does not inherently affect the MTF of a lens, and therefore it is impossible to see it in an MTF curve individually. Distortion is a misplacement of optical information, as opposed to a loss, and so it does not directly affect the MTF of a lens. The technical definition of distortion is magnification that varies with field height. What it looks like in a practical sense is a bend in the image. Large amounts of distortion typically show up in wide-angle and fish-eye lenses, and like field curvature it is not affected by a change in f/#.
The last aberration addressed here is chromatic aberration, which is the change in focal length as the wavelength of light changes. When glass bends light, the magnitude of the bend is based on what is called the index of refraction of the glass. While this concept is widely understood, what is less known is that the index of refraction is actually a function of wavelength; therefore, light will be bent in various degrees through the same piece of glass relative to its color. This means a lens focuses light of different colors at different places. Optical designers use various tools and glass materials to correct for this type of aberration in machine vision objectives, but it is always present to some degree.
There are two types of chromatic aberration: axial and lateral. Axial is the change in focal length with respect to wavelength, as shown in Figure 10.
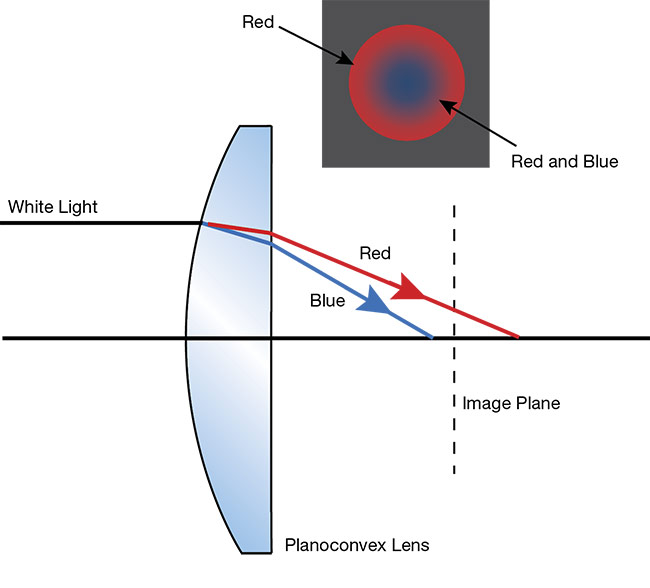
Figure 10. Axial chromatic aberration. Note that the smaller blue wavelengths focus closer than the longer red wavelengths. Courtesy of Edmund Optics.
Since the focal length of a lens differs with respect to the color, this means that the magnification is also different with each color, which leads to lateral chromatic aberration, which manifests off-center in the field of view. In general, it can be difficult to directly show chromatic aberration in an MTF curve, but Figure 11 depicts the comparison of two MTF curves of the same lens — one that is viewing multiple wavelengths (white light) and another that is viewing only one wavelength (blue). The lens used in this example is color-corrected, but it still achieves better performance monochromatically, which is typical for all machine vision lenses. Monochromatic performance will always be better than white-light performance. If at all possible, machine vision systems should be set up with monochromatic lights or with bandpass filters to allow only one color to pass through. This will vastly improve the MTF performance of the system.
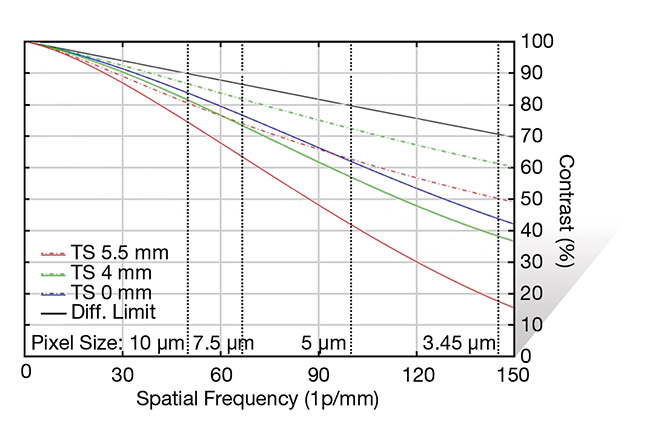
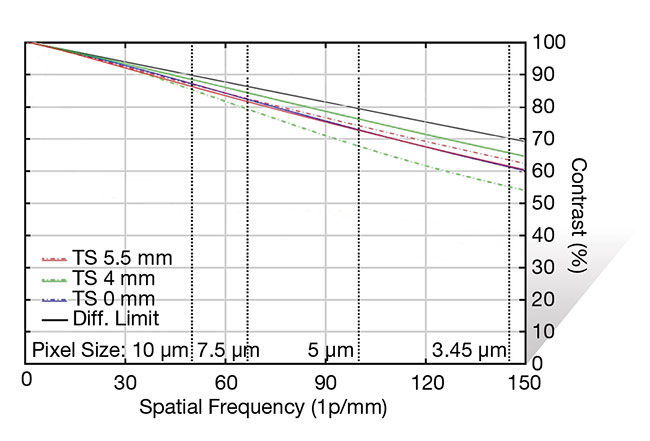
Figure 11. MTF curves for a 12-mm focal length lens with white light (left) and monochromatic blue light (right). The curve on the right is vastly improved in terms of its performance, despite the lens being color-corrected. Courtesy of Edmund Optics.
Aberrations have many different impacts on imaging lens performance. Some optical errors — such as spherical, astigmatism, and coma — can be corrected in the field by changing the f/# of the lens. Others, like field curvature and distortion, cannot be changed and must be worked around. Chromatic aberration can be eliminated almost entirely by using bandpass filters and monochromatic lights. Knowing how to change the MTF of a lens in the field, as well as knowing what is affecting a lens’s performance, will help in the selection of a lens for every application, both to ensure that the lens is not being overspecified and to make sure that it will have enough performance for the task at hand. Optical suppliers should be relied upon to provide MTF information when it is desired to help aid in this task and should be there to explain these concepts in detail if necessary. Lenses are complex devices, and understanding what makes them perform the way they do will help ensure proper specification every time.
Meet the author
Nick Sischka is senior vision solutions engineer at Edmund Optics Inc.’s Barrington, N.J., office. Specializing in optics for vision systems, he supports imaging and machine vision customers with application knowledge and design assistance for modification or customization requirements. He has a bachelor’s in optical sciences and engineering from the University of Arizona College of Optical Sciences; email: [email protected].